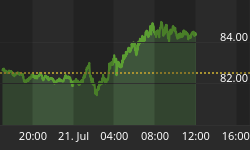
• 657 days Will The ECB Continue To Hike Rates?
  • 657 days Forbes: Aramco Remains Largest Company In The Middle East
  • 659 days Caltech Scientists Succesfully Beam Back Solar Power From Space
  • 1,058 days Could Crypto Overtake Traditional Investment?
  • 1,063 days Americans Still Quitting Jobs At Record Pace
  • 1,065 days FinTech Startups Tapping VC Money for ‘Immigrant Banking’
  • 1,068 days Is The Dollar Too Strong?
  • 1,068 days Big Tech Disappoints Investors on Earnings Calls
  • 1,069 days Fear And Celebration On Twitter as Musk Takes The Reins
  • 1,071 days China Is Quietly Trying To Distance Itself From Russia
  • 1,071 days Tech and Internet Giants’ Earnings In Focus After Netflix’s Stinker
  • 1,075 days Crypto Investors Won Big In 2021
  • 1,076 days The ‘Metaverse’ Economy Could be Worth $13 Trillion By 2030
  • 1,076 days Food Prices Are Skyrocketing As Putin’s War Persists
  • 1,079 days Pentagon Resignations Illustrate Our ‘Commercial’ Defense Dilemma
  • 1,079 days US Banks Shrug off Nearly $15 Billion In Russian Write-Offs
  • 1,082 days Cannabis Stocks in Holding Pattern Despite Positive Momentum
  • 1,083 days Is Musk A Bastion Of Free Speech Or Will His Absolutist Stance Backfire?
  • 1,083 days Two ETFs That Could Hedge Against Extreme Market Volatility
  • 1,085 days Are NFTs About To Take Over Gaming?
Market Sentiment At Its Lowest In 10 Months

Market Sentiment At Its Lowest In 10 Months

Stocks sold off last week…

How The Ultra-Wealthy Are Using Art To Dodge Taxes

How The Ultra-Wealthy Are Using Art To Dodge Taxes

More freeports open around the…

The Problem With Modern Monetary Theory

The Problem With Modern Monetary Theory

Modern monetary theory has been…

  1. Home
  2. Markets
  3. Other

Elliott Wave Analysis: SP500 and USD Index

S&P500

On the hourly chart of S&P500, we can see a higher degree three wave correction unfolding with price currently trading in wave C). We believe some resistance may be in the cards for the S&P500 around the 50.0 or 61.8 Fibonacci ratio, where even previous mid swings of wave 2 and 4 can act as turning points lower.

A five wave drop from current levels would be a confirmation for a change in trend, from bullish to bearish.

S&P500, 1H

S&P500 1-Hour Chart


SILVER

On the 30min chart of SILVER, we are looking at a nice eight wave cycle unfolding, with price specifically trading in the second portion of this wave cycle, in corrective wave B. We know that after every five waves, a contra trend reaction follows, and in our case this reaction can find its base and a bullish turning point around the previous wave 2 swing at the 17.05 level. At the moment however price may still reach for higher levels within wave B, before making a drop into final wave C.

SILVER, 30Min

Silver 30-Minute Chart


Visit our website and Get more charts and forecasts with free access through 14-Day Trial Offer à http://ew-forecast.com/
You can also follow us on twitter @ewforecast


Back to homepage

Leave a comment

Leave a comment