• 288 days Will The ECB Continue To Hike Rates?
  • 288 days Forbes: Aramco Remains Largest Company In The Middle East
  • 290 days Caltech Scientists Succesfully Beam Back Solar Power From Space
  • 690 days Could Crypto Overtake Traditional Investment?
  • 695 days Americans Still Quitting Jobs At Record Pace
  • 697 days FinTech Startups Tapping VC Money for ‘Immigrant Banking’
  • 700 days Is The Dollar Too Strong?
  • 700 days Big Tech Disappoints Investors on Earnings Calls
  • 701 days Fear And Celebration On Twitter as Musk Takes The Reins
  • 703 days China Is Quietly Trying To Distance Itself From Russia
  • 703 days Tech and Internet Giants’ Earnings In Focus After Netflix’s Stinker
  • 707 days Crypto Investors Won Big In 2021
  • 707 days The ‘Metaverse’ Economy Could be Worth $13 Trillion By 2030
  • 708 days Food Prices Are Skyrocketing As Putin’s War Persists
  • 710 days Pentagon Resignations Illustrate Our ‘Commercial’ Defense Dilemma
  • 711 days US Banks Shrug off Nearly $15 Billion In Russian Write-Offs
  • 714 days Cannabis Stocks in Holding Pattern Despite Positive Momentum
  • 715 days Is Musk A Bastion Of Free Speech Or Will His Absolutist Stance Backfire?
  • 715 days Two ETFs That Could Hedge Against Extreme Market Volatility
  • 717 days Are NFTs About To Take Over Gaming?
Is The Bull Market On Its Last Legs?

Is The Bull Market On Its Last Legs?

This aging bull market may…

Billionaires Are Pushing Art To New Limits

Billionaires Are Pushing Art To New Limits

Welcome to Art Basel: The…

How The Ultra-Wealthy Are Using Art To Dodge Taxes

How The Ultra-Wealthy Are Using Art To Dodge Taxes

More freeports open around the…

  1. Home
  2. Markets
  3. Other

Elliott Wave Analysis: GBPUSD and USDJPY

GBPUSD

GBPUSD is weakening and now attacking 1.2411 swing support from last week which may play an important role for a price action ahead. Notice that we are tracking a flat correction; it's an a-b-c structure where sub-wave c normally finds a base at the area of wave a. In our case this is at 1.2411, followed by an important Fib. support zone 100 points lower. So technically speaking we see a set-back, which may stop at 1.2300-1.2400 area this week.

GBPUSD, 1H

GBP/USD 1-Hour Chart

USDJPY

USDJPY has reversed down from around 115.60 with more weakness so we see pair still in a big and important contra-trend move. We are tracking a double zigzag with wave C of Y) in play. Wave C of Y) is showing us qualities of an ending diagonal so a sharp reversal higher may be just around the corner. A break above the 115.60 level would indicate a completed correction and higher levels to follow.
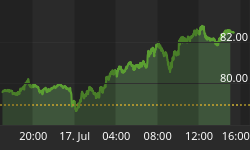
USDJPY, 4H

USD/JPY 4-Hour Chart


Visit our website and Get more charts and forecasts with free access through 14-Day Trial Offer → http://ew-forecast.com/register/
You can also follow us on twitter @ewforecast


Back to homepage

Leave a comment

Leave a comment