


Crude OIL
This is a nice push higher on crude oil despite stronger USD today. We see crude oil making a sharp move up now towards 55.00 which appears to be a wave three of three at the moment, so expect more gains towards 55.30/55.50 in the near term. Any intraday bearish reactions will be temporary and part of an uptrend while price is above 54.18, but 53.27 can be more important for uptrend to stay valid.
Crude OIL, 1h

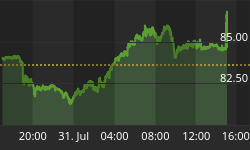
USDJPY
USDJPY is turning bullish from 112.60 with five waves, which means more upside will be expected after any pullback in three waves on 30min chart. We suspect that this first leg up can be part of a much stronger and larger uptrend especially if we consider the correlation with NIKKEI. If Nikkei is headed higher then normally USDJPY will follow it. Well, if you will look at 4h chart of Nikkei you can see a clear A-B-C-D-E triangle formation which is a bullish structure that suggests a break to a new high, therefore a lot more upside can be seen on USDJPY also.
USDJPY, 30Min

Nikkei, 4H

Visit our website and Get more charts and forecasts with free access through 14-Day Trial Offer
You can also follow us on twitter @ewforecast
www.ew-forecast.com


