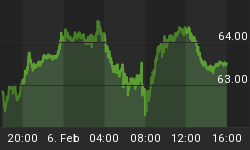
While we expected the gold stocks to correct and test GDX $22 and GDXJ $35, we did not expect it to happen so quickly. It literally took only three days! Gold stocks rebounded on Friday and managed to close the week above those key levels. While gold stocks could bounce or consolidate for a few days, we would advise patience as lower levels could be tested as spring begins.
The weekly candle charts of GDX and GDXJ are shown below along with their 80-week moving average. For the entire week, GDX and GDXJ declined 8% and nearly 12% respectively. Although miners recovered Friday, the weekly candles signal the kind of selling pressure that do not exactly mark "higher lows" within an uptrend. In other words, while miners could recover for a few days or even a week or two, I would expect lower levels to be tested. That essentially includes the 80-week moving averages and the December lows.

In order to get a sense for the strong support levels, I use a daily line chart which helps to smooth out the volatility. The miners essentially have two points of strong support. The first is a wide area that includes $20-$21 for GDX as well as $31-$32 for GDXJ. That target area includes the 400-day moving average for both GDX and GDXJ. If that target area fails to hold for a few days or even a week then look for strong support at the December lows.

In short, the next quality buying opportunity figures to be at a retest of the 400-day moving average or perhaps a retest of the December lows. A weekly close above GDX $25 and GDXJ $40 would invalidate our cautious view. We expect the next several months could be a grind as the sector oscillates between support and resistance. It's hard to do but the way to play that is to buy weakness and avoid chasing strength.
For professional guidance in riding this new bull market, consider learning more about our premium service including our current favorite junior miners.


