• 323 days Could Crypto Overtake Traditional Investment?
  • 327 days Americans Still Quitting Jobs At Record Pace
  • 329 days FinTech Startups Tapping VC Money for ‘Immigrant Banking’
  • 332 days Is The Dollar Too Strong?
  • 333 days Big Tech Disappoints Investors on Earnings Calls
  • 334 days Fear And Celebration On Twitter as Musk Takes The Reins
  • 335 days China Is Quietly Trying To Distance Itself From Russia
  • 336 days Tech and Internet Giants’ Earnings In Focus After Netflix’s Stinker
  • 340 days Crypto Investors Won Big In 2021
  • 340 days The ‘Metaverse’ Economy Could be Worth $13 Trillion By 2030
  • 341 days Food Prices Are Skyrocketing As Putin’s War Persists
  • 343 days Pentagon Resignations Illustrate Our ‘Commercial’ Defense Dilemma
  • 343 days US Banks Shrug off Nearly $15 Billion In Russian Write-Offs
  • 347 days Cannabis Stocks in Holding Pattern Despite Positive Momentum
  • 347 days Is Musk A Bastion Of Free Speech Or Will His Absolutist Stance Backfire?
  • 347 days Two ETFs That Could Hedge Against Extreme Market Volatility
  • 350 days Are NFTs About To Take Over Gaming?
  • 350 days Europe’s Economy Is On The Brink As Putin’s War Escalates
  • 353 days What’s Causing Inflation In The United States?
  • 354 days Intel Joins Russian Exodus as Chip Shortage Digs In
Tesla Struggles To Compete In European Market

Tesla Struggles To Compete In European Market

Tesla continues to catch the…

What's Behind The Global EV Sales Slowdown?

What's Behind The Global EV Sales Slowdown?

An economic slowdown in many…

How Millennials Are Reshaping Real Estate

How Millennials Are Reshaping Real Estate

The real estate market is…

  1. Home
  2. Markets
  3. Other

Elliott Wave Analysis: USDCAD and SP500

USDCAD

USDCAD broke down from a fourth wave consolidation. We were looking for fifth wave lower as you know, to complete a larger impulsive decline. Well, notice that current bearish leg came out of a triangle, so we know it's a final part of a bigger pattern, which means that market can be now ready to reverse. Technically speaking we expect a recovery in three waves back to 1.3365-1.3400 area from where we will look for a new sell-off, while 1.3535 level is not breached.

USDCAD, 1H

USD/CAD 1-Hour Chart


S&P500

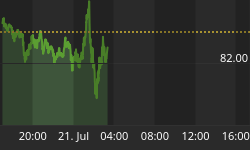
E-mini S&P500 keeps moving lower now with sharp intraday price move following recent break below 2369 bearish level. So far, we can see a nice and extended leg down which can be wave three within a five wave decline that can be headed back to 2345 while market trades below 2382.

S&P500, 1H

S&P500 1-Hour Chart


Visit our website and Get more charts and forecasts with free access through 14-Day Trial Offer
You can also follow us on twitter @ewforecast
www.ew-forecast.com


Back to homepage

Leave a comment

Leave a comment