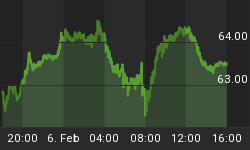
USDJPY
30 min
4 Hours
Daily
My Bias:Â LONG
Wave Structure:Â rally in wave [C]
Long term wave count:Â wave [C] is underway, upside to above 136.00
Important risk events:Â JPY: N/A. USD: Unemployment Claims, PPI m/m, Prelim UoM Consumer Sentiment.
I am a contrarian at heart,
And right now, as the whole world is shunning the USD, I am getting even more bullish on the old Greenback!
At this moment, USDJPY is approaching a low at five degrees of trend!
Wave 'c' brown has a complete five wave structure on display as shown on the short term chart.
The divergence is growing now between the declining price and the rising RSI on the 4hr chart.
This correction has reached exhaustion point,
And as I said yesterday, it is time to start looking upwards for the Dollar.
The price will meet the blue trend line at about 1.0880 and change.
Watch for a change of direction ath that point.
A higher low should form after the completion of wave '4' orange.
The next leg up will be powerful and take this market to new multi year highs in a new bull market run.
Dow Jones Industrials
30 min
4 Hours
Daily
My Bias:Â market top is in.
Wave Structure:Â Impulsive 5 wave structure, possibly topping in an all time high.
Long term wave count:Â Topped in wave (5)
Important risk events:Â USD: Unemployment Claims, PPI m/m, Prelim UoM Consumer Sentiment.
The DOW took another impulsive looking dive lower this evening.
The ease at which this market sheds points should be of some concern to the bulls out there.
But the crowd never notices the bubble they are living within.
The immediately bearish wave count remains in place,
And critical support lies at 20410.
The market continues to make lower highs off the recent wave 'ii' high,
And 20750 is proving a strong resistance level.
The current wave count continues to call for a new bout of selling to come in
Which should bring this market a whole lot lower.
For tomorrow watch for a break of 20509 in an impulsive fashion.
Tomorrow is an important day as the market is closed on Friday this week.
The European markets are closed on Monday.
So a down day tomorrow could set the tone for next week.
Gold
30 min
4 Hours
Daily
My Bias:Â Long towards 1550
Wave Structure:Â ZigZag correction to the upside.
Long term wave count:Â Topping in wave (B) at 1500
Important risk events:Â USD: Unemployment Claims, PPI m/m, Prelim UoM Consumer Sentiment.
Another good day in the bag for the Gold wave count.
The price rallied above wave '1' pink and is now closing in on the upper trend line as expected.
Third waves are usually the longest and strongest movement.
So
From here I would like to see the price movements of wave (iii) blue stretch the overall structure of the wave.
This would create that classic third wave 'look' of an elongated wave.
I dont think wave '3' pink is complete yet,
the price should ideally push out above the upper trend line
and then use that trend line as support for the remainder of wave (iii).


