• 657 days Will The ECB Continue To Hike Rates?
  • 657 days Forbes: Aramco Remains Largest Company In The Middle East
  • 659 days Caltech Scientists Succesfully Beam Back Solar Power From Space
  • 1,059 days Could Crypto Overtake Traditional Investment?
  • 1,063 days Americans Still Quitting Jobs At Record Pace
  • 1,065 days FinTech Startups Tapping VC Money for ‘Immigrant Banking’
  • 1,068 days Is The Dollar Too Strong?
  • 1,069 days Big Tech Disappoints Investors on Earnings Calls
  • 1,070 days Fear And Celebration On Twitter as Musk Takes The Reins
  • 1,071 days China Is Quietly Trying To Distance Itself From Russia
  • 1,072 days Tech and Internet Giants’ Earnings In Focus After Netflix’s Stinker
  • 1,076 days Crypto Investors Won Big In 2021
  • 1,076 days The ‘Metaverse’ Economy Could be Worth $13 Trillion By 2030
  • 1,077 days Food Prices Are Skyrocketing As Putin’s War Persists
  • 1,079 days Pentagon Resignations Illustrate Our ‘Commercial’ Defense Dilemma
  • 1,079 days US Banks Shrug off Nearly $15 Billion In Russian Write-Offs
  • 1,083 days Cannabis Stocks in Holding Pattern Despite Positive Momentum
  • 1,083 days Is Musk A Bastion Of Free Speech Or Will His Absolutist Stance Backfire?
  • 1,084 days Two ETFs That Could Hedge Against Extreme Market Volatility
  • 1,086 days Are NFTs About To Take Over Gaming?
  1. Home
  2. Markets
  3. Other

May 8-11… High or Low?

May 8-11… High or Low?

In the 4/17/17 Market Update I wrote of a low-low-high interval pointing to a high on 5/11/17.

The lows of July 8, 1932 and December 9, 1974 were arguably the two most important lows of the 20th century. They lie 15,494 days apart. Adding an additional 15,494 days to the 1974 low points to a high on May 11, 2017.

In the 4/24/17 Market Update I wrote of a Hybrid Lindsay forecast pointing to a high in the period May 8-11.

The Hybrid Lindsay model confirms that forecast for a high in the Dow near May 11. The Hybrid model points to inflections points of both major and minor highs and lows so it does NOT confirm the low-low-high forecast for a major high – only that we should see a decline of unknown degree start near that time period.

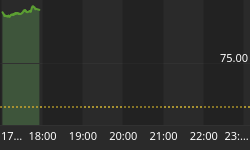
There have been a handful of instances in the past when the Hybrid model forecast both a high and a low on or near the same date. Checking the forecast for a low uncovered the same anomaly for the May 8-11 time period. I’m leaning heavily toward the original forecast for a high – not just because of the low-low-high interval forecast – but because the patterns pointing to a high are “cleaner” than the patterns pointing to a low and a 21-day cycle points to a high today (chart). Either way, an inflection point is due this week.

(Click to enlarge)

By Ed Carlson for Safehaven.com

Back to homepage

Leave a comment

Leave a comment