• 106 days Will The ECB Continue To Hike Rates?
  • 107 days Forbes: Aramco Remains Largest Company In The Middle East
  • 108 days Caltech Scientists Succesfully Beam Back Solar Power From Space
  • 508 days Could Crypto Overtake Traditional Investment?
  • 513 days Americans Still Quitting Jobs At Record Pace
  • 515 days FinTech Startups Tapping VC Money for ‘Immigrant Banking’
  • 518 days Is The Dollar Too Strong?
  • 518 days Big Tech Disappoints Investors on Earnings Calls
  • 519 days Fear And Celebration On Twitter as Musk Takes The Reins
  • 521 days China Is Quietly Trying To Distance Itself From Russia
  • 521 days Tech and Internet Giants’ Earnings In Focus After Netflix’s Stinker
  • 525 days Crypto Investors Won Big In 2021
  • 525 days The ‘Metaverse’ Economy Could be Worth $13 Trillion By 2030
  • 526 days Food Prices Are Skyrocketing As Putin’s War Persists
  • 528 days Pentagon Resignations Illustrate Our ‘Commercial’ Defense Dilemma
  • 529 days US Banks Shrug off Nearly $15 Billion In Russian Write-Offs
  • 532 days Cannabis Stocks in Holding Pattern Despite Positive Momentum
  • 533 days Is Musk A Bastion Of Free Speech Or Will His Absolutist Stance Backfire?
  • 533 days Two ETFs That Could Hedge Against Extreme Market Volatility
  • 535 days Are NFTs About To Take Over Gaming?
Is The Bull Market On Its Last Legs?

Is The Bull Market On Its Last Legs?

This aging bull market may…

How The Ultra-Wealthy Are Using Art To Dodge Taxes

How The Ultra-Wealthy Are Using Art To Dodge Taxes

More freeports open around the…

  1. Home
  2. Markets
  3. Other

Elliott Wave Analysis: Dax and Silver

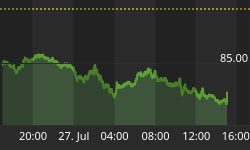
Dax recently traded into our region of resistance, near the Fibonacci ratio of 50.0 and 61.8, which usually presents a turning point zone. This means more weakness could follow on the pair in the near-term. A breach below the previous swing low of wave B would be and indication for more bearish pressure.

German dax, 1h

German DAX 1-Hour Chart

Silver is undergoing a sharp and strong recovery within wave 3)/C), which means we can see metal reach even higher in days ahead. We have 17.46/17.70 region in view, where Fibonacci projection indicates a wave 3) or C) termination point. Even recent breach above the upper channel line indicates more gains to follow and a possible support for upcoming minor corrections.

Silver, 1h

Silver 1-Hour Chart


Interested in our services? We have a Special Offer: Get 2 Months For Price of 1!! Grab the opportunity now at www.ew-forecast.com


Back to homepage

Leave a comment

Leave a comment