


July 2, 2017
Current Position of the Market
SPX Long-term trend: Uptrend continues with a serious loss of upside momentum in weekly indicators.
SPX Intermediate trend: An ending diagonal appears to be forming.
Analysis of the short-term trend is done on a daily-basis with the help of hourly charts. It is an important adjunct to the analysis of daily and weekly charts which discuss longer market trends.
Is this the Top?
Market Overview
Perhaps only short-term! Last week, I suggested that SPX may be forming a fractal, with the first pattern about to be duplicated by a second, similar one. With the second pattern topping at 2353 and dropping down to 2406 last week, this seems to have been a valid suggestion, but whether the decline is complete or not remains to be seen. We did see a good (even strong) bounce after the index found support just above the 2400 peak of early March 2017.
The decline retraced slightly less than .382 of the distance from the low of the pull-back from the 2400 top (2322, 3/27) and the 2453 top, which could be one of the reasons we had such a good bounce. But we could still retrace a little lower to 2388 (50%) or 2373 (.618) before the correction is over, and if this is all the weakness we get, we could still make another high between 2480 and 2500, which would form the third pattern of the fractal – actually, the 5th wave of an ending diagonal.
In strong markets, reaching a top seems to take forever and this is the reason some traders go short early and live to regret it. In this case, another slightly higher high would be logical since both the projection from 2330 and the structure are calling for it.
Analysis: (These Charts and subsequent ones courtesy of QCharts.com)
Daily chart
SPX’s uptrend which started from 1810 in early 2016 has evolved into a broad channel. Since January 2017 the index has, with one exception, traded between the mid-channel line and the bottom of the first quartile of that channel. The last two minor moves have respected both lines with last week’s low finding support on the mid-channel line once again before bouncing. This time, it was reinforced by support at the 2400 high of January, and the 55-DMA, in addition to the .382 retracement mentioned above. There is a pretty good chance that we will retest that low and perhaps even break it. Should we do so, there are two lower levels of support that have been marked on the chart and either one could be the low of the correction if we do not stop at Thursday’s level. Of course, if we keep on going past 2372, we would have to assume that we are already in an intermediate correction.
Some argument could be made for that if we back-track in our count, and consider the pattern which starts on 3/27 as wave 1, and the last as 5. But while that would dubiously satisfy the structure, it would not satisfy the count to about 2500. So we’ll need to wait for a little more data to get some clarification.
CCI gave a sell signal but may have found support, and the other two oscillators are beginning to show some positive divergence, so we’d better wait a few more days to make a near-term forecast.

Hourly chart
The dashed lines are the same as on the daily chart, above. The bottom one, which is the mid-channel line of the large channel resisted penetration on Thursday. In addition, prices held at a strong support level, and at the bottom of a short-term corrective channel, (actually, 2) and this may be all we get for a short-term correction ending wave 4 of the diagonal. If we fail to move below the red horizontal line over the next few days, the odds are pretty good that we will turn up again.
Even if we go lower, we have additional support down to about 2372. The last-minute selling which occurred on Friday may only have be cautionary, but if we move lower on Monday or Wednesday, the correction is not over.
The strength of the bounce from Thursday’s low is a bullish omen, but the indicators failed to give a confirmed buy signal and turned back down at Friday’s close. It’s now only a question of holding above 2406 to signal the potential resumption of the uptrend.

An overview of some important indexes (daily charts)
Some of the leading indexes have undergone a little more intermediate consolidation than others, but even the lower tier, which has lagged, is not showing real weakness. If we are looking for these indicators to give us advanced warning for the top of the bull market, it does not appear anywhere.

UUP (dollar ETF)
The P&F chart projection to 24.50 for the end of this correction may turn out to be correct. Last week’s low was overcome by another wave of weakness. 20 cents more, and the projection will be met. Perhaps afterwards we can look for a decent rally to materialize.

GDX (Gold Miners ETF)
GDX continues to consolidate, but with the low of the cycle due over the next few days, it may soon be heading in the opposite direction. The price action does not reflect real weakness, just a lack of interest on the part of buyers.

Note: GDX is now updated for subscribers throughout the day, along with SPX.
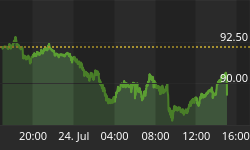
USO (U.S. Oil Fund)
As suspected, USO was due for a bounce after reaching the coincident lows of both corrective channels. A move to 10.00/10.50 would not be unreasonable, but some consolidation should occur before moving out of the steeper channel.

Summary
There are two possible courses of action for SPX over the near-term: 1) It is already at or near the low of a near-term correction and will need to make another new high between 2480-2500 before starting an intermediate correction, or 2) the intermediate correction has already started. Until we see greater weakness develop, we must favor the first option.
By Andre Gratian


