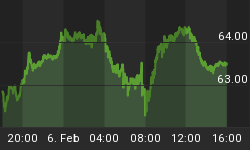
DOW drops 200 points in lock step with wave count!
USDJPY
30 min

4 Hours

Daily

My Bias: LONG
Wave Structure: rally in wave [C]
Long term wave count: wave [C] is underway, upside to above 136.00
Important risk events: JPY: Monetary Policy Statement. USD: Housing Starts, Building Permits, Crude Oil Inventories.
I have altered the wave count today,
to what I think is the next best fit labeling
given the fall off the recent high.
This new interpretation is possibly even more bullish than before,
The extent of the decline off the recent high now labelled wave (i) green at 1.1449,
was larger than expected in the previous wave count.
Todays low is now labelled wave (ii) green.
The decline has traced out a double combination wave structure.
Todays low reached 111.68.
The 50% retracement level lies at 111.64, a 4 pip difference.
So:
This sets up another bullish opportunity in wave (iii) green,
should this wave count prove correct.
At this point the 4hr momentum indicators are again reaching an oversold extreme,
Form here,
I am looking for a clear 5 wave rise off todays low,
That may happen over the next couple of days.
DOW JONES INDUSTRIALS
30 min

4 Hours

Daily

My Bias: market topping process ongoing
Wave Structure: Impulsive 5 wave structure, possibly topping in an all time high.
Long term wave count: Topping in wave (5)
Important risk events: USD: Housing Starts, Building Permits, Crude Oil Inventories.
Last nights wave count called for a decline in wave 'c'
With the initial target set at 21436.
The DOW tumbled 200 points today and reached a low of 21465.
This action again points to the value of a good working knowledge of the wave principle.
And the opportunities it can unlock when no-one else expects them.
The market has again rallied higher in the beginning of a possible wave 'd' pink.
Wave 'd' pink is projected to meet the trendline in the region of 21625.
And again the rally should occur in three waves.
Wave 'a' blue looks complete at the evening highs of 21575.
The contracting triangle model has worked well so far,
But just in case the rally extend higher than 21681,
The alternate wave count is shown circled in red, on the short term chart.
For today,
Watch for the completion of wave 'd' pink, and a possible turn into wave 'e' to complete the triangle.
By Edna Glynn


