Since the Basic Materials sector is breaking out I would like to take an in-depth look at some of the stocks that make up the Basic Materials sector along with some commodities in general. Most commodities have had a tough go of it since they topped out in 2011, but there are some signs that they may be bottoming, which could lead to a substantial rally over the intermediate to the long term. As you will see some of the bottoming formations are very symmetrical while others are pretty ugly, but as long as they can make a higher high and higher low an uptrend is in place.
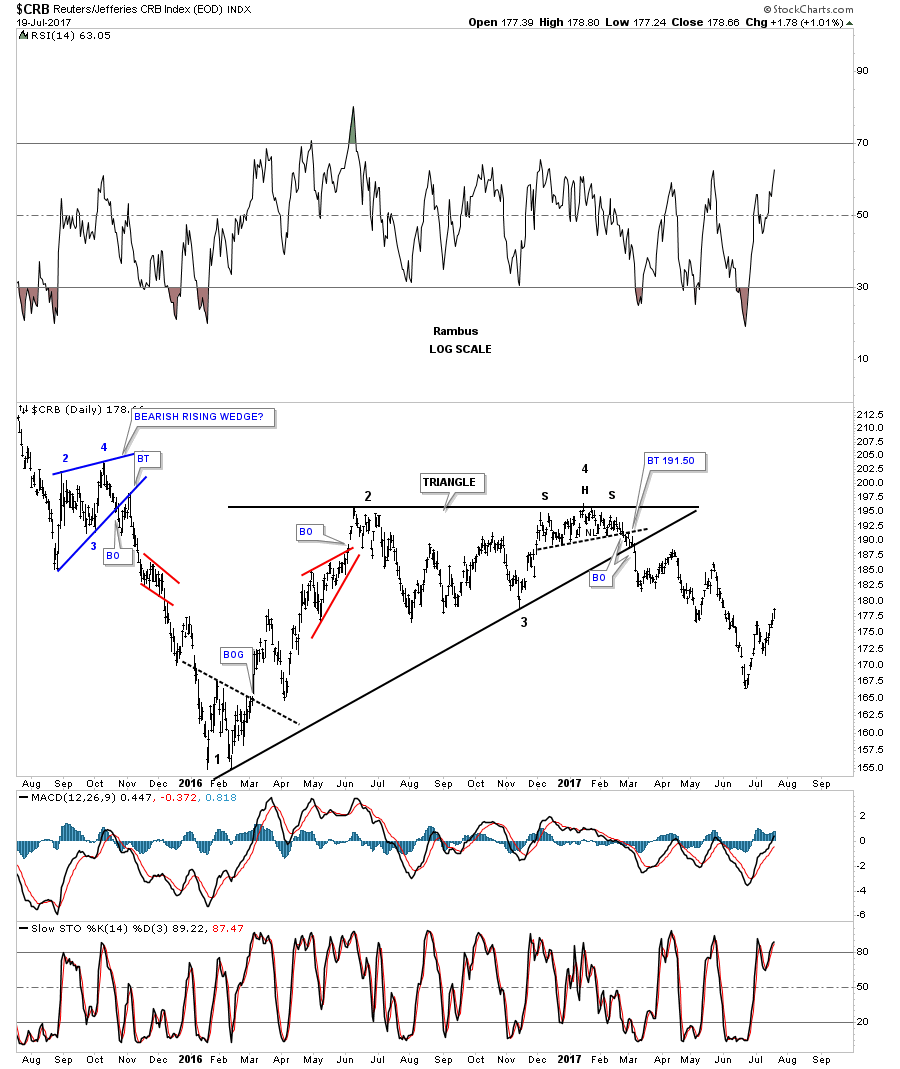
Lets start with the CRB index which built out a one year bearish rising wedge formation that broke to the downside in March of this year. The price action has been chopping to the downside and has gotten a bounce to the upside in late June. Normally the price objective of a rising wedge is down to the first reversal point where the pattern started to build out.
There is another pattern I’ve been keeping a close eye on which may have given us a good clue today that we may have a consolidation pattern building out which is forming above the January 2016 low. As you can see on this long term daily chart for the CRB index it has built out a sideways trading range which broke to the downside last month, which wasn’t a bullish development if one was bullish on this index.
Expanding patterns, whether they’re a triangle, flat top or flat bottom, expanding falling wedges or expanding rising wedges, are some of the more difficult formations to find in real time. The reason being is that with the pattern on this daily chart below shows a false breakout below the bottom rail, blue horizontal dashed line, which looks like a breakout to the downside. With today’s price action closing back above the blue dashed line we now have a potential flat top expanding triangle. If the price actions can close above the top horizontal trendline, the flat top triangle will be the first consolidation pattern in the CRB’s index’s new bull market.
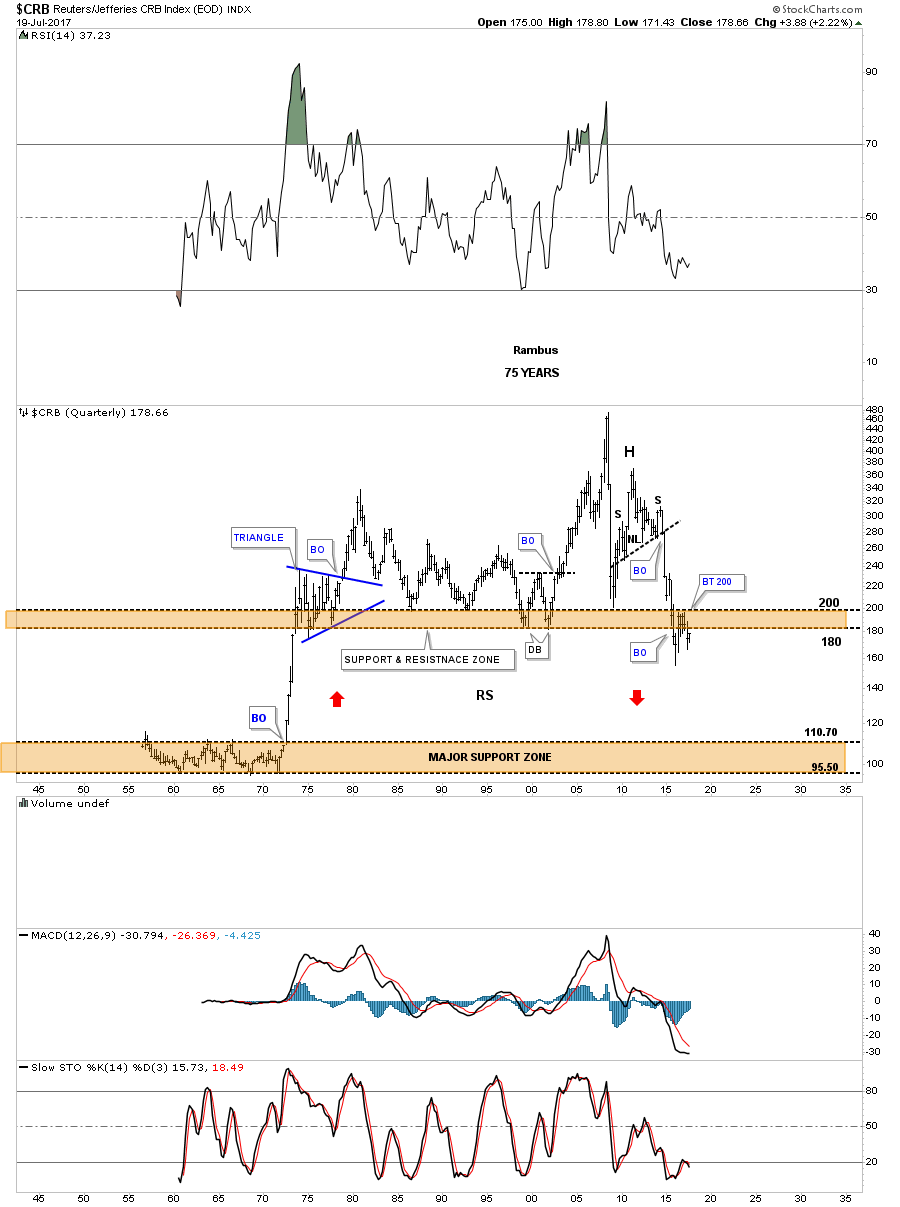
This 75 year quarterly chart for the CRB index shows you just just how bad the bear market has been. To really get this index bullish again I would love to see the price action trading back above the brown shaded S&R zone above 200 or so, which would create an unbalanced double bottom. By looking at the daily chart above you can see how the unbalanced double bottom would look like if the top rail of the expanding flat top triangle is broken to the upside. If the possible unbalanced double bottom plays out we are just in the first inning of a 9 inning game.
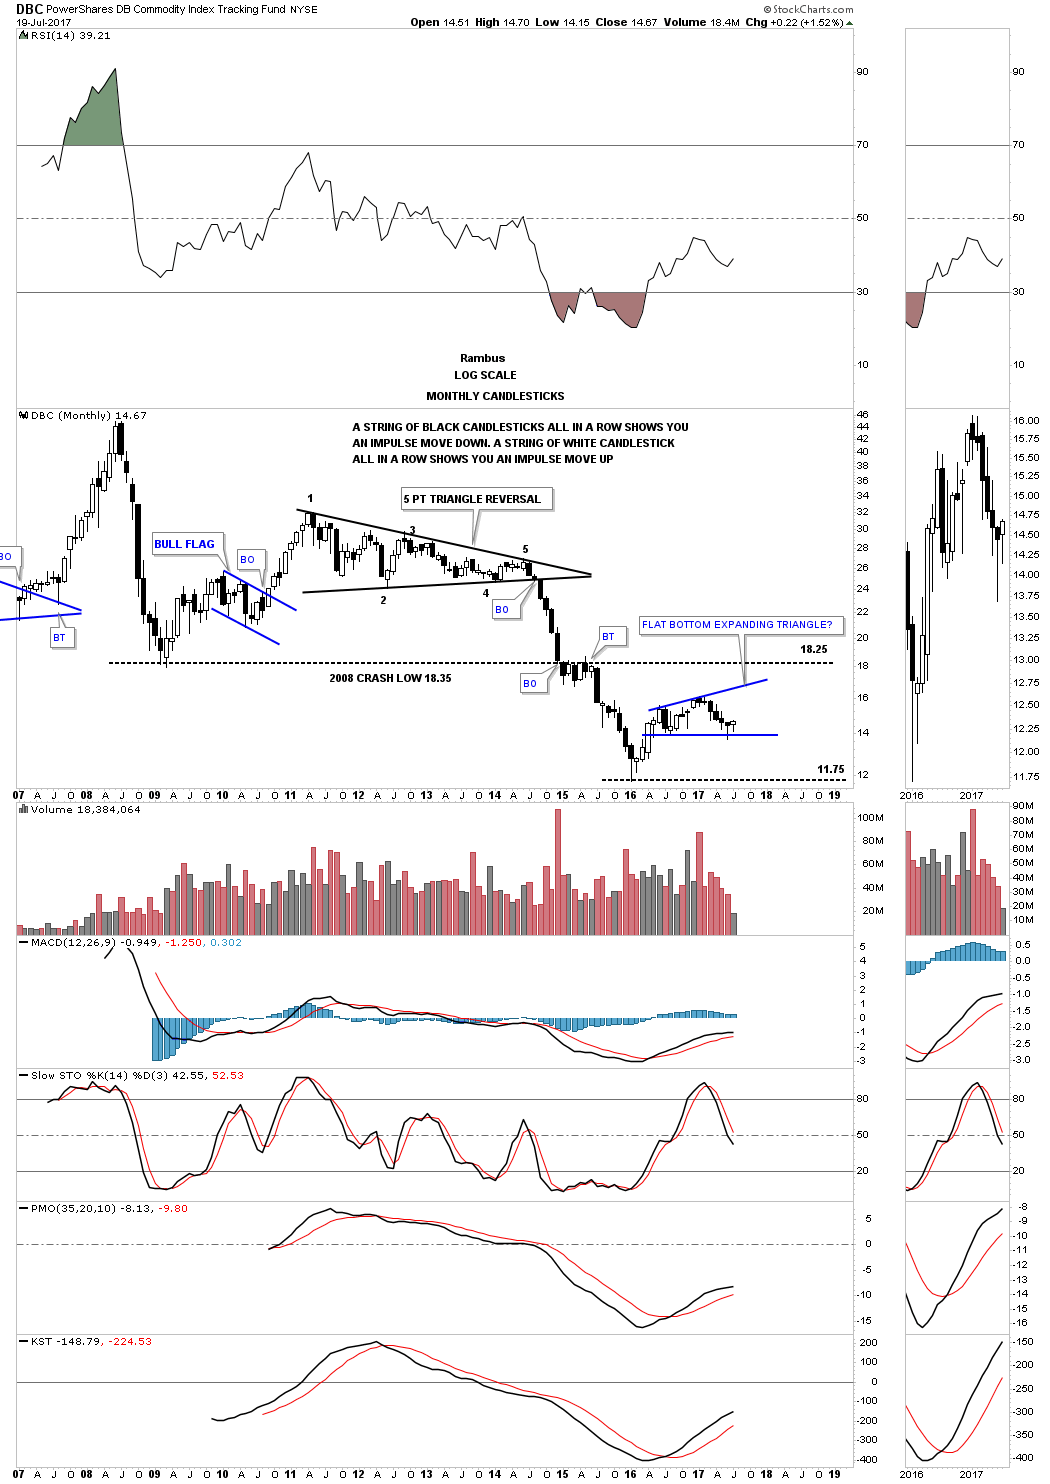
This next commodities chart is a long term monthly look at the DBC which is much more actively traded than the CRB index. Instead of an expanding flat top triangle the DBC is building out a possible flat bottom triangle. Again, this potential pattern has a chance to be a consolidation pattern to the upside if it can take out the top rail. No matter how you look at the current price action there is still a lot of work to do before we get any type of resolution to the trading range. A break below the bottom rail will ensure a move back down to the previous low and on the other hand, a breakout above the top rail will put the bull market thesis into play.
Next I would like to focus in on the XLB, basic materials index, which is made up of many large cap stocks. The last time I did an in depth report on the XLB, I suggested this index should do very well as long as its top 5 components were doing well.
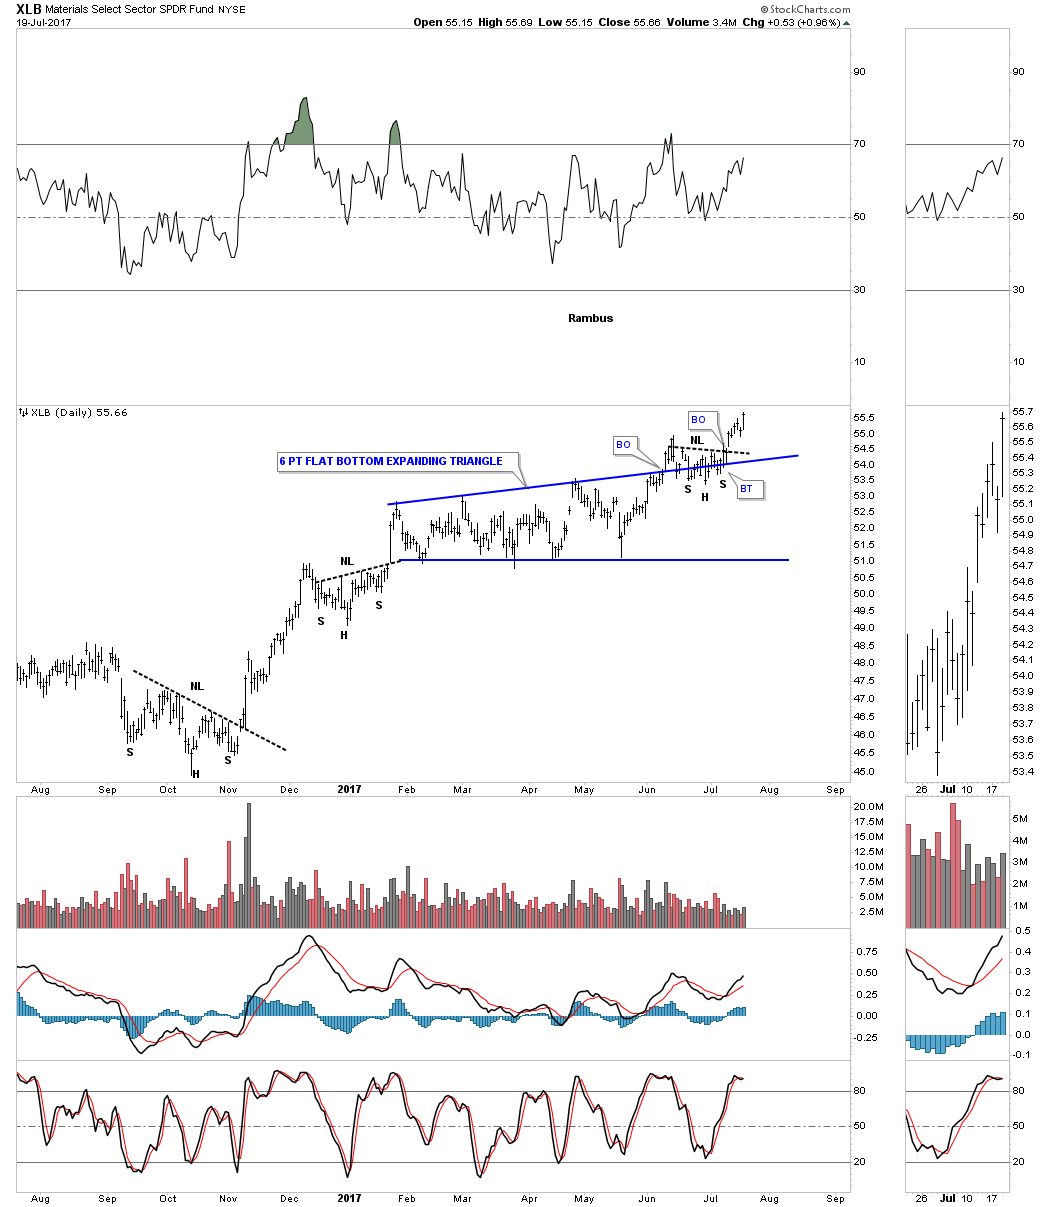
Now lets take a look a daily chart for the XLB, basic materials index, which is showing it has just broken out of a 6 month blue expanding flat bottom triangle with a small H&S bottom that formed as the backtest. Today this basic materials index closed at a new all time high.
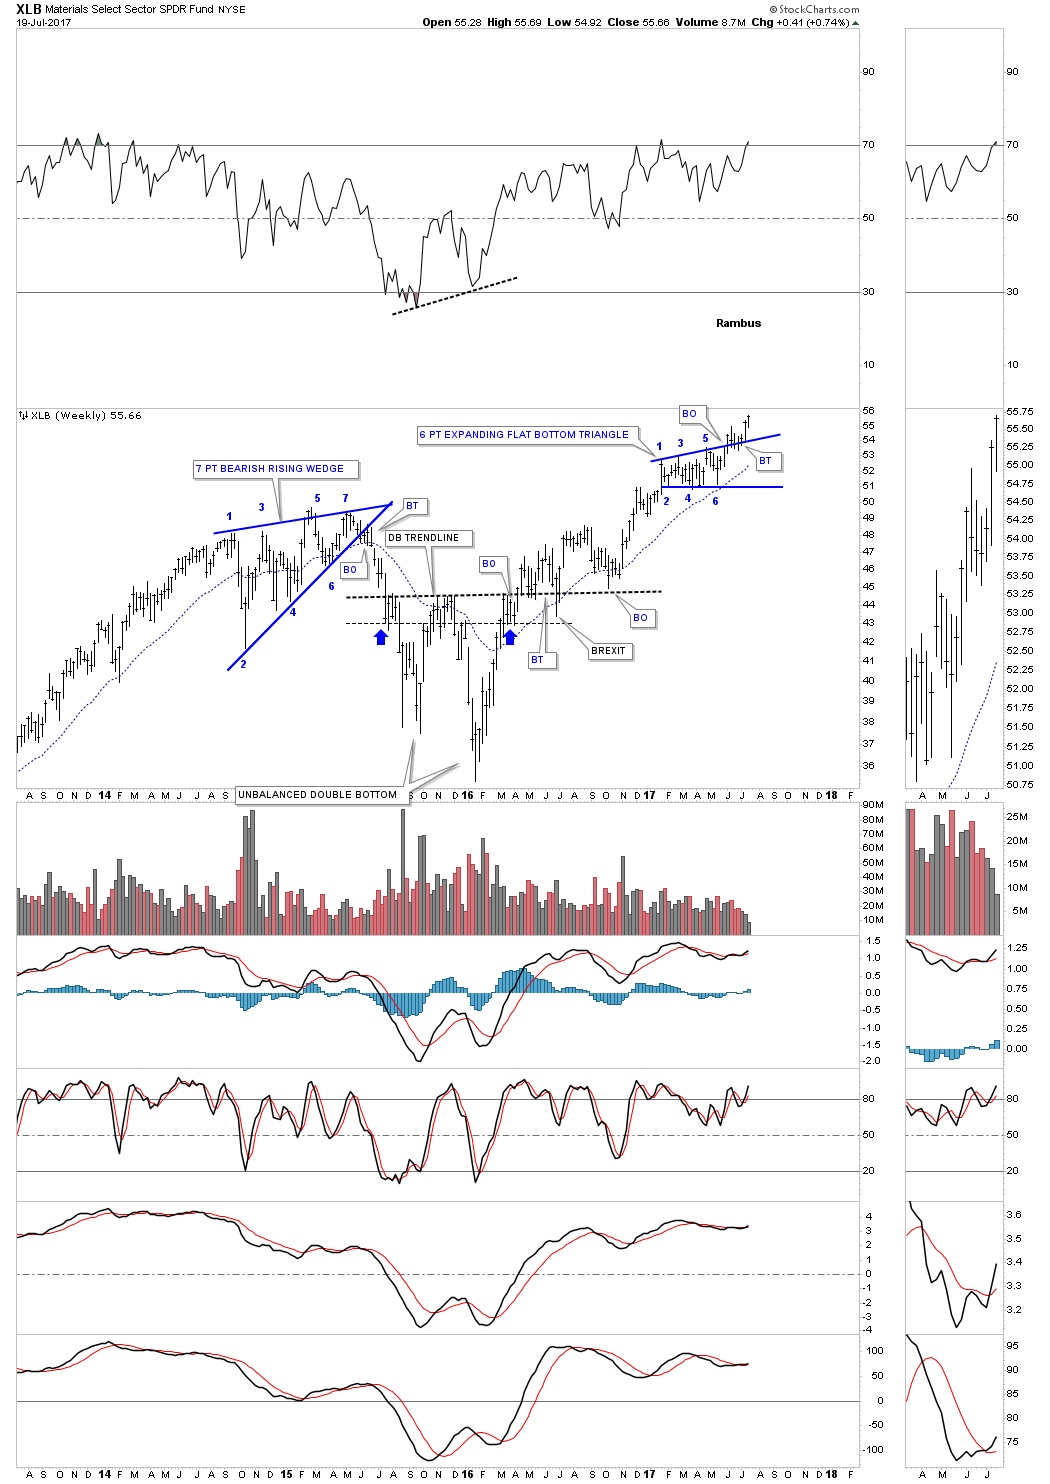
Below is a 4 year weekly bar chart that is showing the breakout from the 6 point flat bottom triangle consolidation pattern into new all time highs this week.
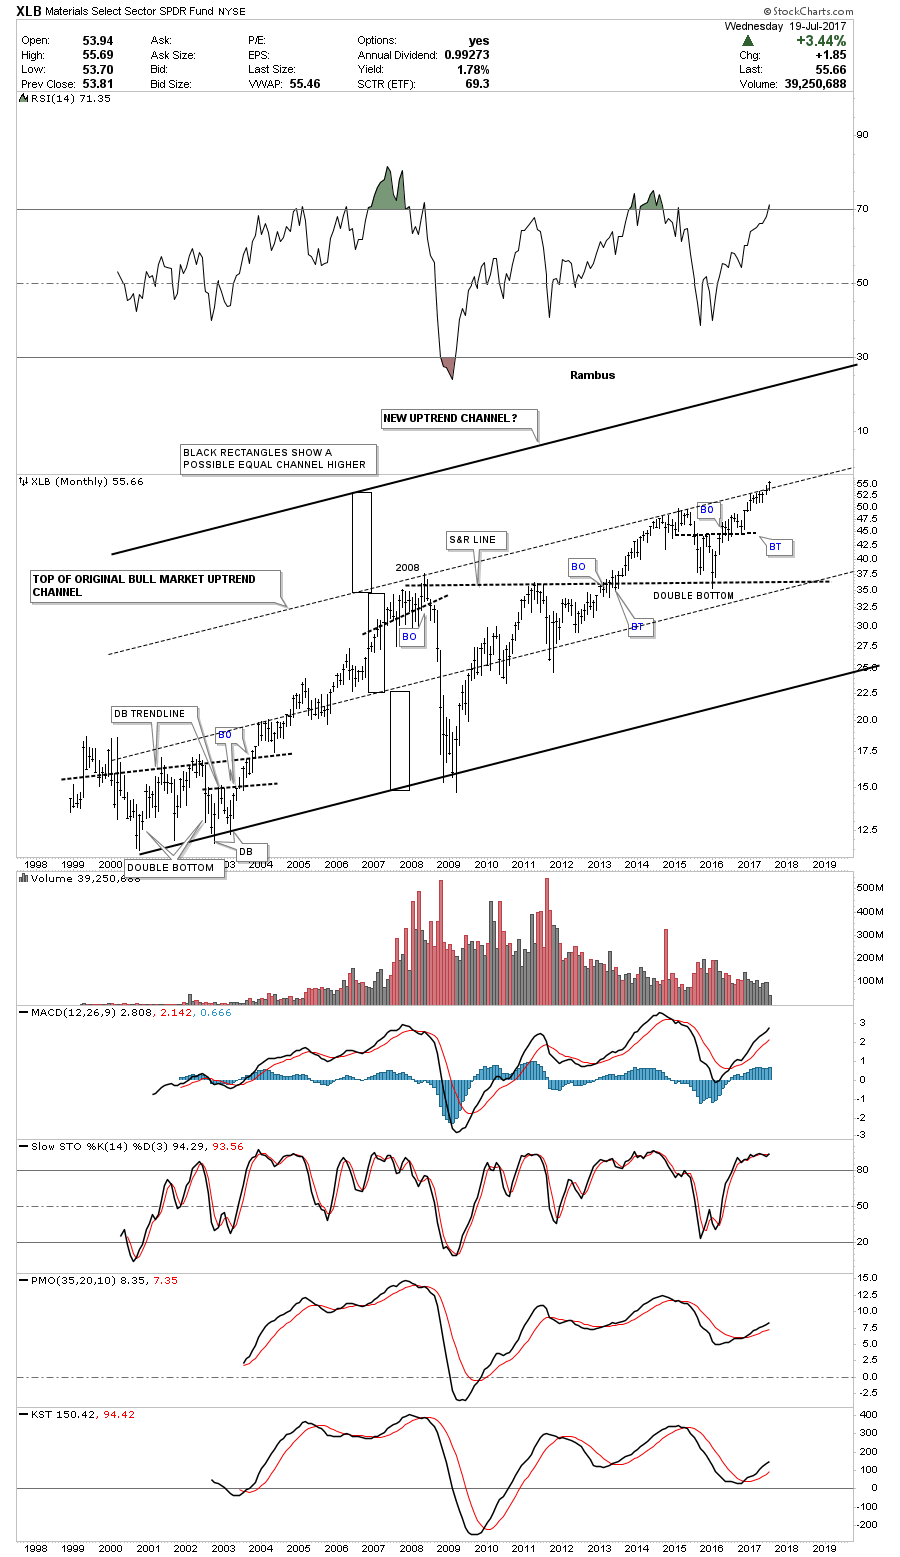
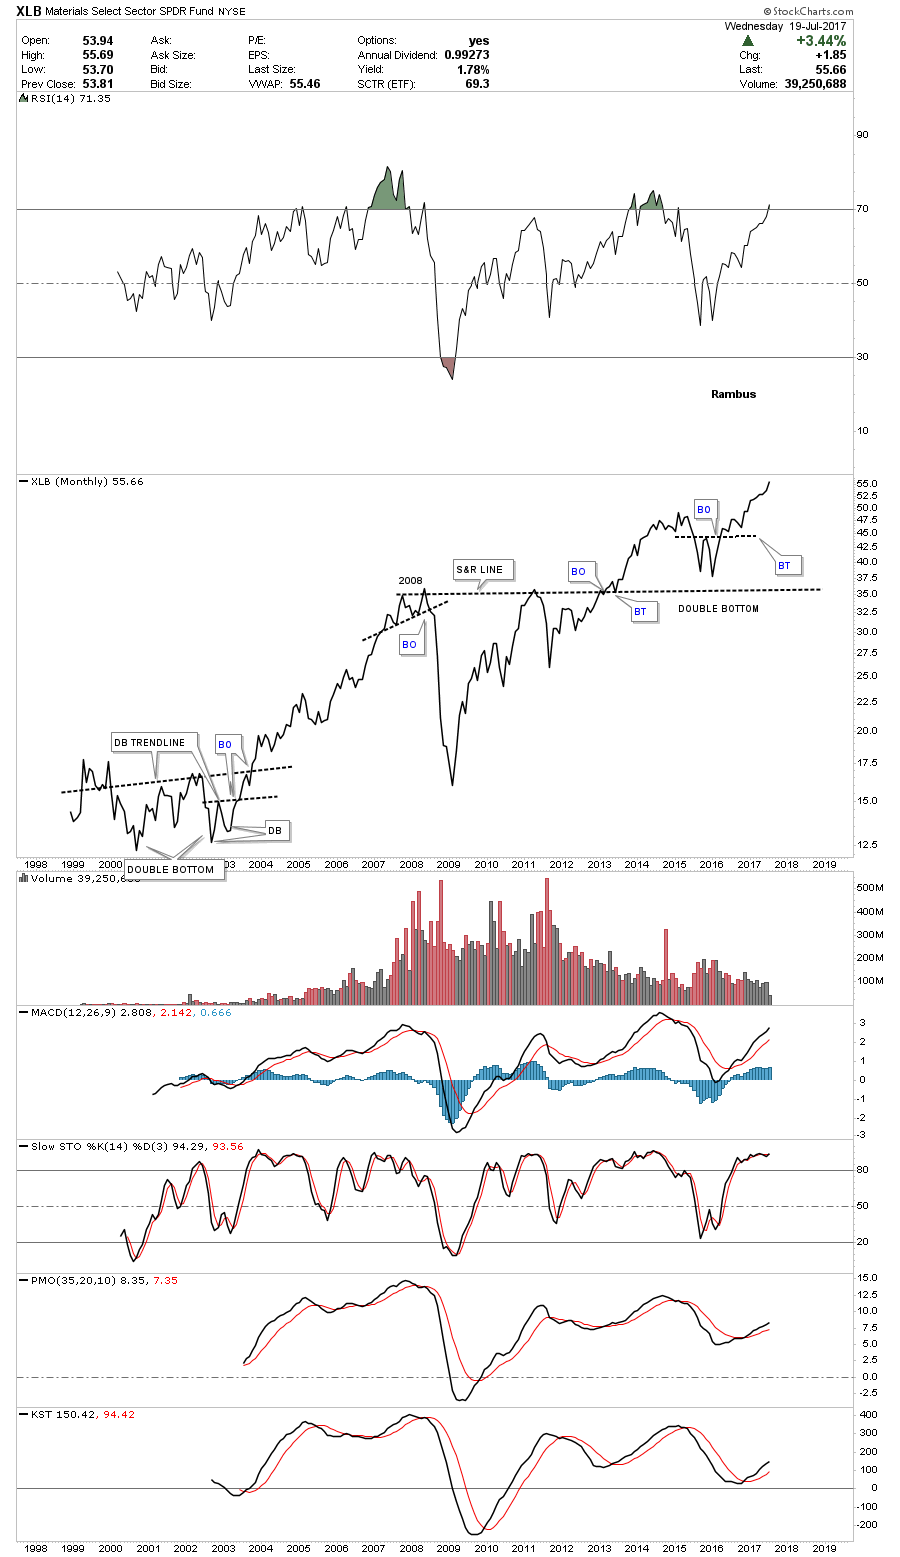
The long term monthly chart for the XLB shows its entire history and its bull market uptrend channel. If the 6 point expanding flat bottom triangle is breaking out topside then the original top rail of the major uptrend channel will be taken out. Generally when that happens you can see another equal channel higher giving the uptrend 3 equal channels instead of two. The black rectangles shows how this new uptrend may play out.
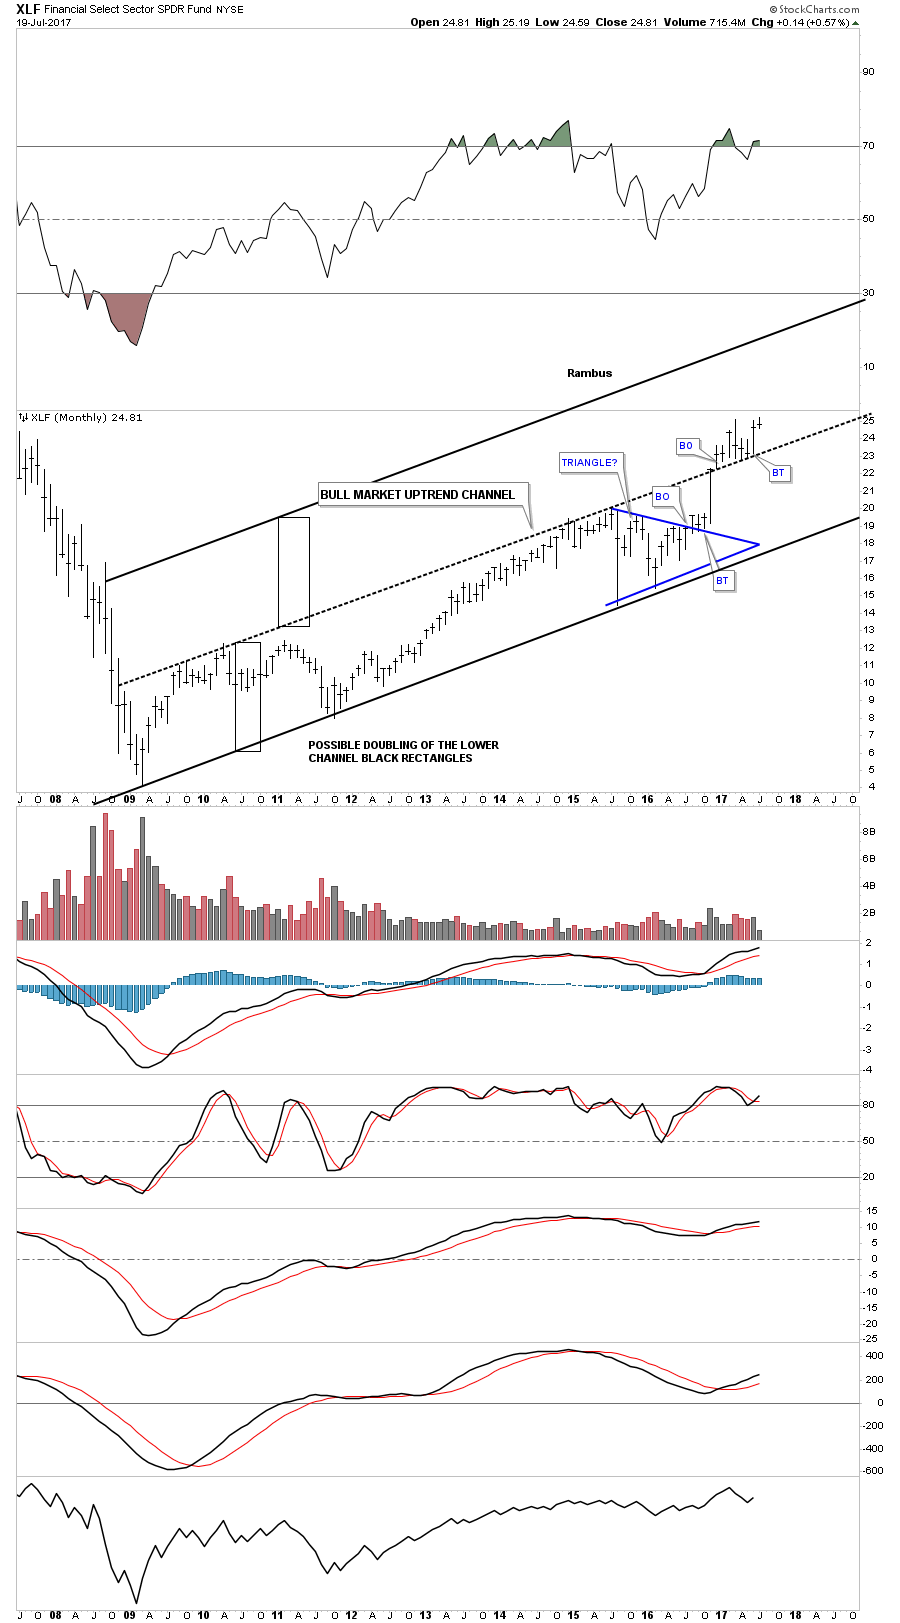
This next chart is a long term monthly chart for the XLF which I’ve been showing you how the lower channel may be morphing into a double uptrend channel with equal lower and upper channels. This is the same principle as the XLB chart above which is forming a possible third channel.
This last chart for the XLB is a monthly line chart going back 20 years. The reason the XLB looks so good is because it’s made up of many very big large cap stocks that we’ll look at in a moment.
Next lets look at the XME, metals and mining etf, which broke out of a double H&S bottom last fall and has recently been backtesting the neckline forming the blue falling wedge as the backtest. Last week the price action finally closed above the 30 week ema.
The first 5 stocks that make up the XLB account for nearly 45% of this index. For 2 years the DOW, Dow Chemical, built out an expanding triangle that broke out to the upside about 8 months ago, and is currently trading at a new all time high. It has the highest weighting at 12.1%
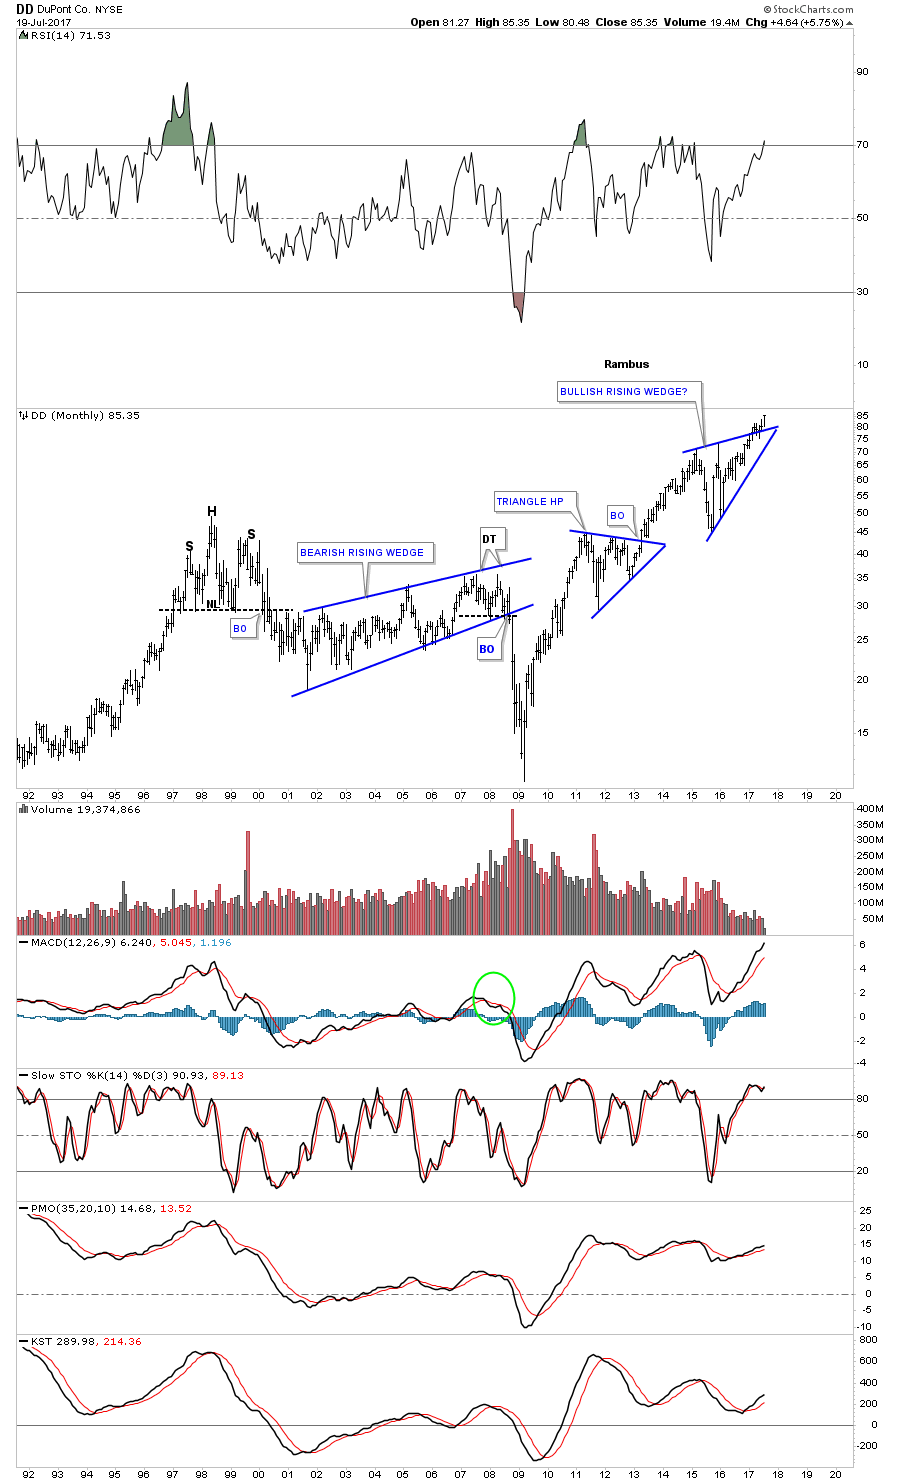
Next is DD, DuPont, which has broken out of a bullish rising wedge which makes up 11.9% of the XLB and is also trading at a new all time high.
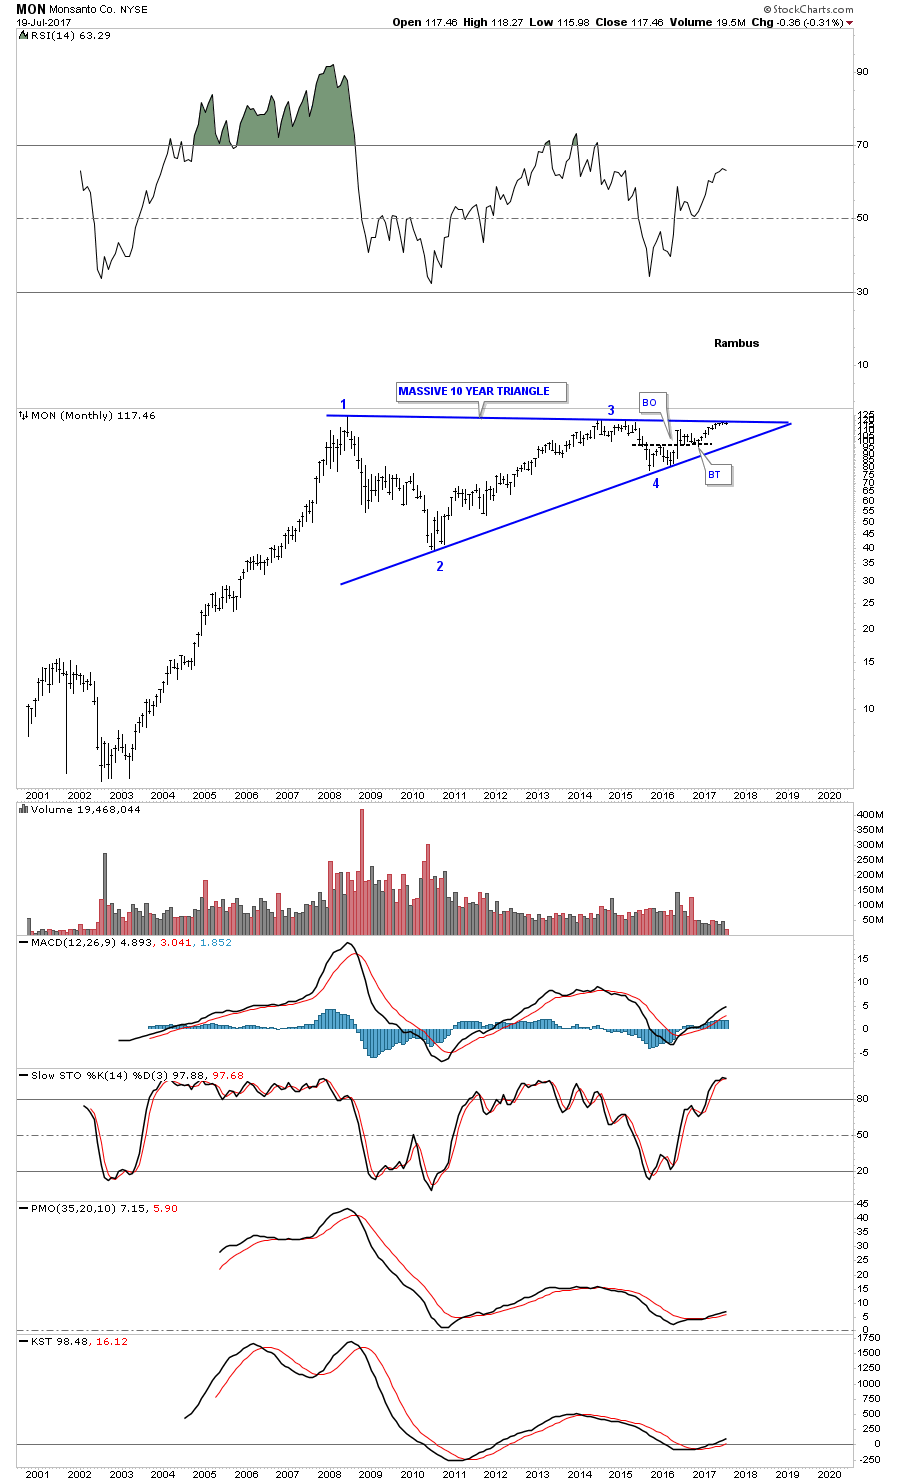
Below is a monthly chart for MON, Monsanto, which is just completing the 4th reversal point in a massive 10 year triangle trading range. It has a weighting of 9% in the XLB.
Number 4 on the list is PX, Praxair, which is still trading inside of its bull market uptrend channel that began to form way back at the 2000 low. It has a weighting of 5.9% and is trading close to new all time highs.
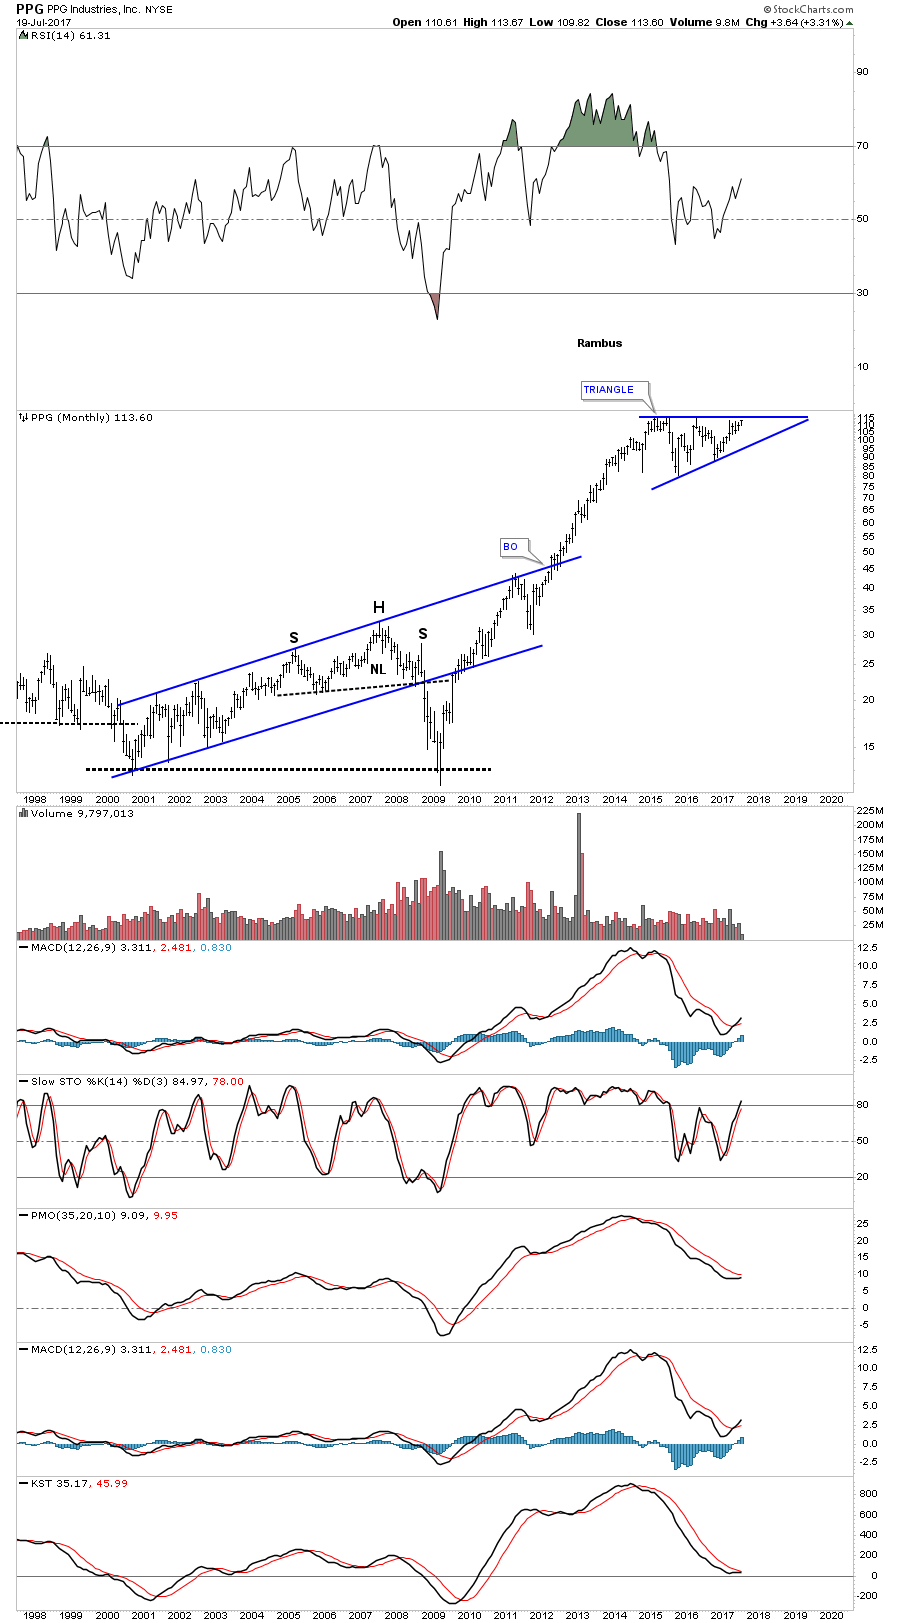
PPG. PPG industries, is 5th on the list and is trading close to new all time highs building out a very large triangle consolidation pattern. It has a weighting of 4.8%.
In part 2 of this report we’ll look at some of the different commodities and stocks within those commodities which are all over the place at the moment with some showing strength while other as still showing weakness. At some point if the bull market really takes off we should see the whole complex moving up together with all areas enjoying their own individual bull markets. One step at a time. All the best…Rambus
By Rambus Chartology


