• 968 days Will The ECB Continue To Hike Rates?
  • 968 days Forbes: Aramco Remains Largest Company In The Middle East
  • 970 days Caltech Scientists Succesfully Beam Back Solar Power From Space
  • 1,370 days Could Crypto Overtake Traditional Investment?
  • 1,375 days Americans Still Quitting Jobs At Record Pace
  • 1,377 days FinTech Startups Tapping VC Money for ‘Immigrant Banking’
  • 1,380 days Is The Dollar Too Strong?
  • 1,380 days Big Tech Disappoints Investors on Earnings Calls
  • 1,381 days Fear And Celebration On Twitter as Musk Takes The Reins
  • 1,382 days China Is Quietly Trying To Distance Itself From Russia
  • 1,383 days Tech and Internet Giants’ Earnings In Focus After Netflix’s Stinker
  • 1,387 days Crypto Investors Won Big In 2021
  • 1,387 days The ‘Metaverse’ Economy Could be Worth $13 Trillion By 2030
  • 1,388 days Food Prices Are Skyrocketing As Putin’s War Persists
  • 1,390 days Pentagon Resignations Illustrate Our ‘Commercial’ Defense Dilemma
  • 1,391 days US Banks Shrug off Nearly $15 Billion In Russian Write-Offs
  • 1,394 days Cannabis Stocks in Holding Pattern Despite Positive Momentum
  • 1,395 days Is Musk A Bastion Of Free Speech Or Will His Absolutist Stance Backfire?
  • 1,395 days Two ETFs That Could Hedge Against Extreme Market Volatility
  • 1,397 days Are NFTs About To Take Over Gaming?
  1. Home
  2. Markets
  3. Other

GLD …Break Out Day

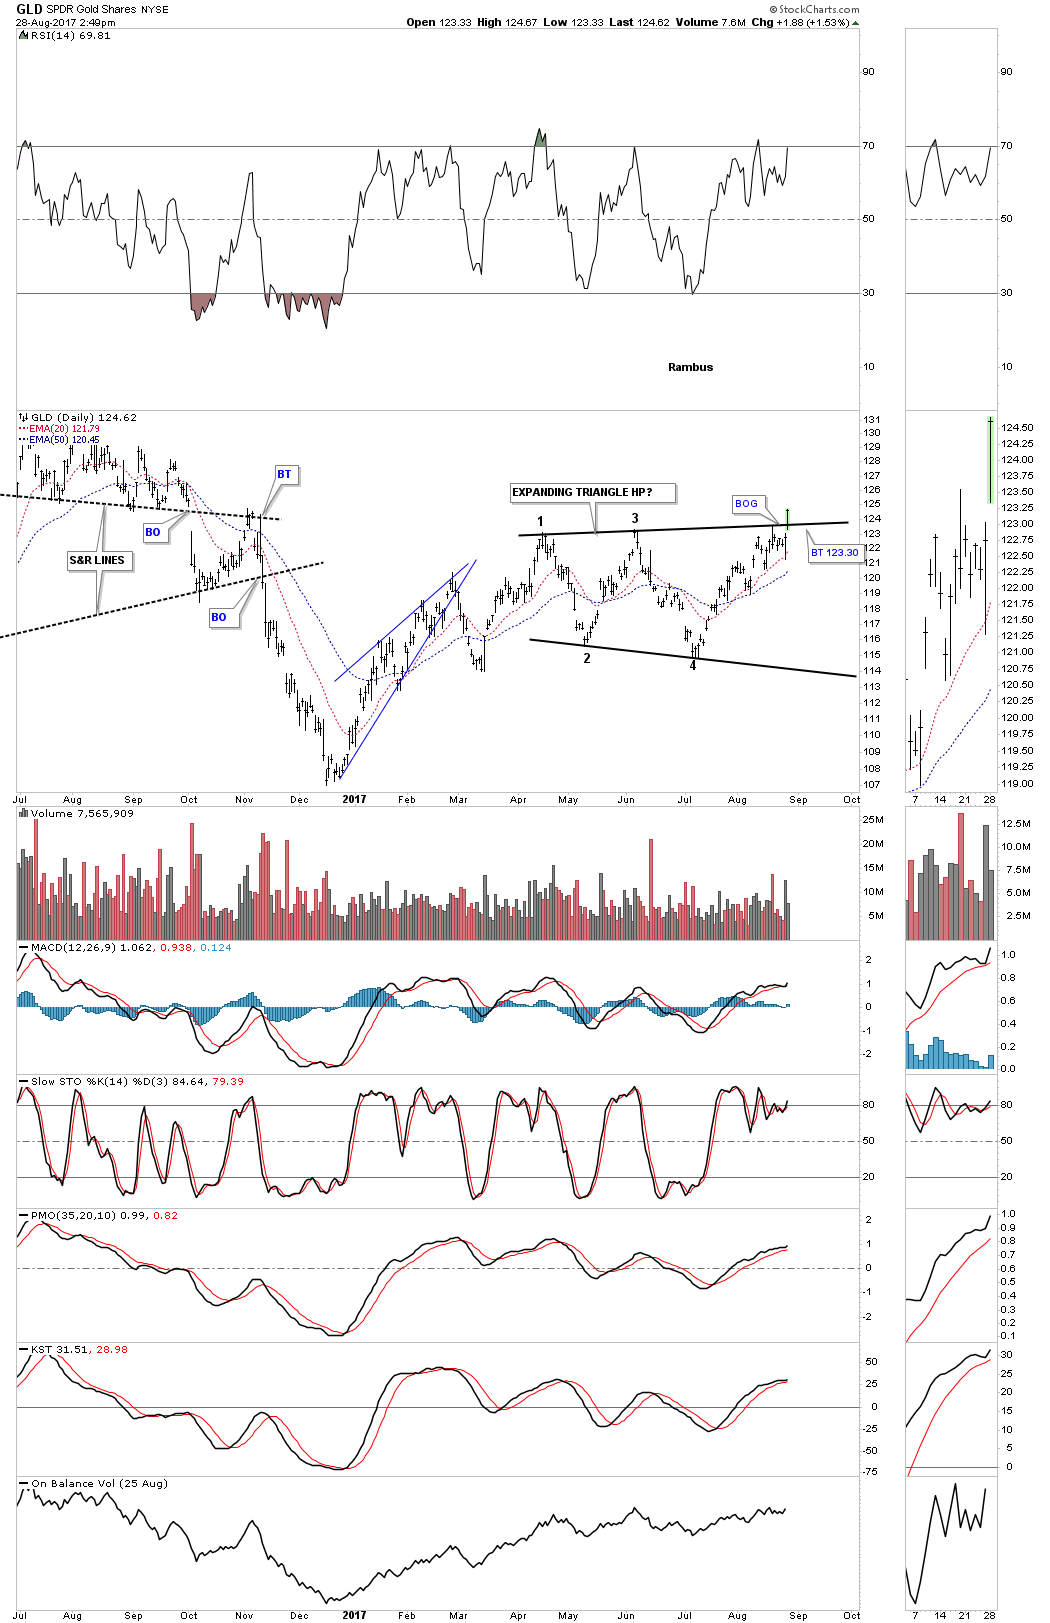
Below is a short term daily chart for GLD which shows it breaking out above the top rail of the blue expanding triangle today.

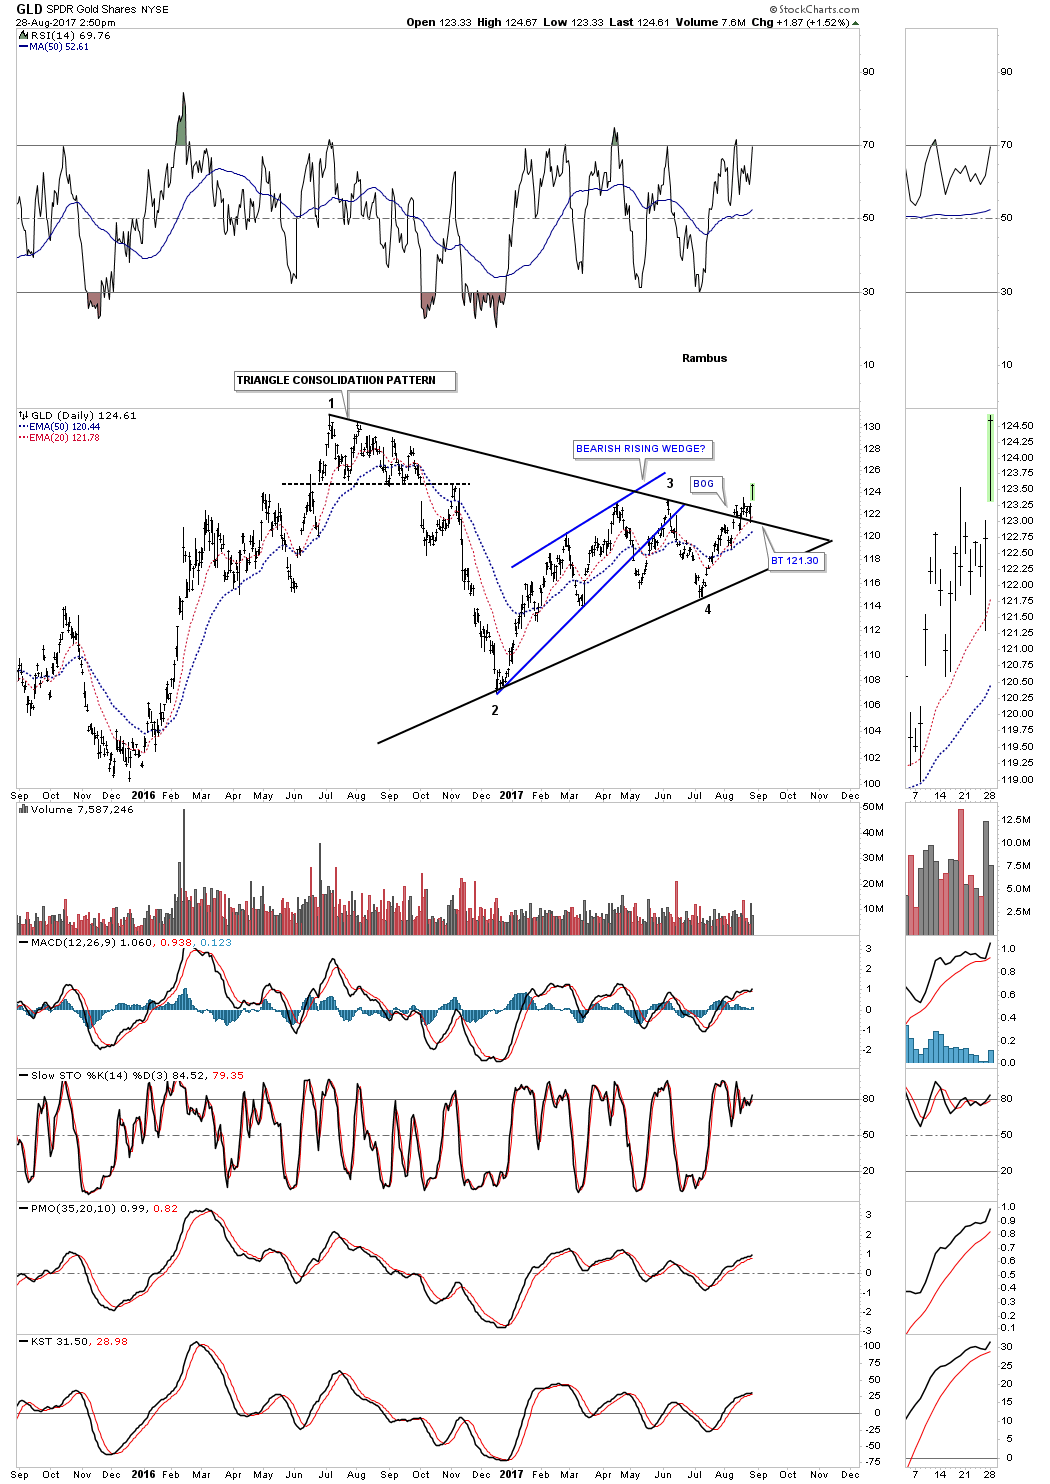
The longer term 2 year daily chart shows GLD breaking out and backtesting the top rail of the triangle consolidation pattern. It looks like all the work is now finished with the breaking out and backtesting process.

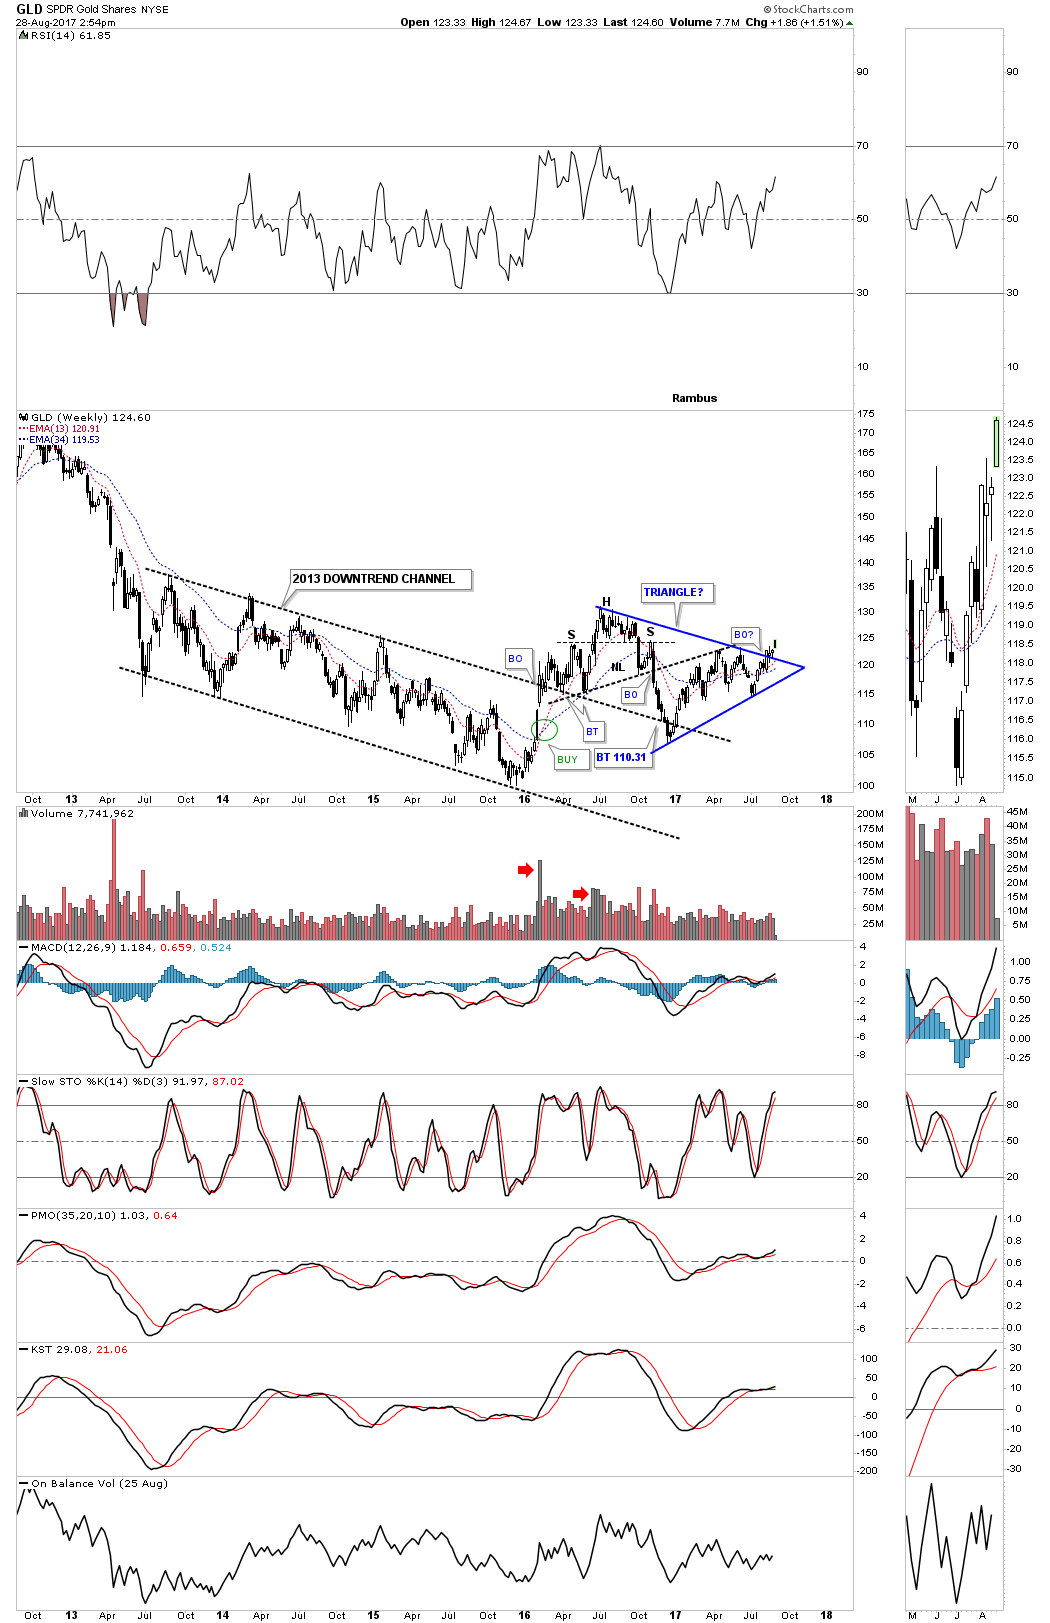
Below is the 5 year weekly chart for perspective.

By Rambus

Back to homepage

Leave a comment

Leave a comment