


The good news is:
- The turnaround point for this decline should be easy to identify.
The Negatives
New lows on both the NYSE and NASDAQ have reached uncomfortable levels and new highs have disappeared.
The first chart covers the past 6 months showing the NASDAQ composite (OTC) in blue and a 40% trend (4 day EMA) of NASDAQ new highs divided by new highs + new lows (OTC HL Ratio), in red. Dashed vertical lines have been drawn on the 1st trading day of each month. Dashed horizontal lines have been drawn at 10% levels for the indicator; the line is solid at the 50%, neutral, level.
OTC HL Ratio continued its fall to finish the week at a very weak 17%.

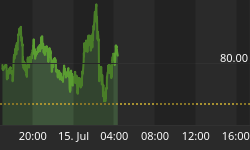
The next chart is similar to the one above one except it shows the S&P 500 (SPX) in red and NY HL Ratio, in blue, has been calculated with NYSE data.
NY HL Ratio fell to an oversold 10%.

The next chart covers the past 6 months showing the SPX in red and a 10% trend (19 day EMA) of NYSE new lows (NY NL) in blue. NY NL has been plotted on an inverted Y axis so decreasing new lows move the indicator upward (up is good).
NY NL will provide the clearest signal that this decline is over. It is NOT giving that signal now.

The next chart is similar to the one above except it shows the OTC in blue and OTC NL, in brown, has been calculated using NASDAQ data.
OTC NL is also falling sharply.

The Positives
The market is oversold.
The all time highs a couple weeks ago were confirmed by everything that matters. The implication of that is, at least, the blue chip indices should return to their old highs before a bear market really gets going.
Bear markets do not start from confirmed all time highs.
Seasonality
Next week includes the 5 trading days prior to the 3rd Friday of February during the 2nd year of the Presidential Cycle. The tables below show the daily change, on a percentage basis for that period.
OTC data covers the period from 1963 to 2016 while SPX data runs from 1953 to 2016. There are summaries for both the 2nd year of the Presidential Cycle and all years combined. Prior to 1953 the market traded 6 days a week so that data has been ignored.
Average returns for the coming week have been mostly positive.
Report for the week before the 3rd Friday of February.
The number following the year is the position in the Presidential Cycle.
Daily returns from Monday through 3rd Friday.
OTC Presidential Year 2
Year Mon Tue Wed Thur Fri Totals
1966-2 0.23% -0.22% -0.47% 0.50% 0.13% 0.19%
1970-2 -0.17% -0.10% -0.17% 0.67% 0.02% 0.26%
1974-2 -1.16% -0.69% -0.46% 0.14% 0.85% -1.32%
1978-2 -0.23% -0.54% -0.21% -0.38% 0.08% -1.29%
1982-2 0.00% -0.99% 0.30% 0.07% -0.40% -1.02%
1986-2 0.00% 0.61% 0.15% 0.06% 0.72% 1.54%
1990-2 -0.57% -0.15% 0.19% 0.72% -0.14% 0.04%
1994-2 0.52% 0.59% 0.32% -0.30% -0.18% 0.95%
Avg -0.10% -0.09% 0.15% 0.03% 0.02% 0.05%
1998-2 0.00% -0.41% 0.72% 0.66% 0.06% 1.04%
2002-2 1.53% -0.67% 1.36% -0.85% -2.07% -0.71%
2006-2 -0.98% 1.00% 0.63% 0.80% -0.53% 0.92%
2010-2 0.00% 1.40% 0.55% 0.69% 0.10% 2.74%
2014-2 0.00% 0.68% -0.82% 0.70% -0.10% 0.46%
Avg 0.28% 0.40% 0.49% 0.40% -0.51% 0.89%
OTC summary for Presidential Year 2 1966 - 2014
Avg -0.10% 0.04% 0.16% 0.27% -0.11% 0.29%
Win% 38% 38% 62% 77% 54% 69%
OTC summary for all years 1963 - 2017
Avg 0.09% -0.08% 0.10% 0.15% -0.12% 0.12%
Win% 59% 50% 58% 62% 49% 60%
SPX Presidential Year 2
Year Mon Tue Wed Thur Fri Totals
1954-2 -0.31% -0.88% 0.19% 0.39% -0.15% -0.76%
1958-2 -0.53% 0.15% -0.05% -0.58% -0.07% -1.09%
1962-2 -0.03% -0.01% -0.04% 0.45% -0.21% 0.16%
1966-2 -0.17% -0.51% -0.01% -0.54% -0.27% -1.50%
1970-2 -0.08% -0.12% 1.24% 0.37% 0.31% 1.72%
1974-2 -1.81% 0.31% 0.04% -0.03% 1.45% -0.04%
Avg -0.52% -0.04% 0.24% -0.07% 0.24% -0.15%
1978-2 -0.24% -0.91% -0.24% -0.84% -0.14% -2.37%
1982-2 0.00% -0.28% -0.32% 0.11% -0.53% -1.02%
1986-2 0.00% 1.22% -1.21% 1.12% 1.08% 2.21%
1990-2 -1.06% 0.28% 0.30% 0.87% -0.65% -0.26%
1994-2 0.01% 0.49% 0.06% -0.52% -0.56% -0.53%
Avg -0.43% 0.16% -0.28% 0.15% -0.16% -0.39%
1998-2 0.00% 0.26% 0.91% -0.37% 0.57% 1.38%
2002-2 1.43% -0.40% 0.99% -0.18% -1.10% 0.75%
2006-2 -0.33% 1.00% 0.35% 0.73% -0.17% 1.59%
2010-2 0.00% 1.80% 0.42% 0.66% 0.22% 3.10%
2014-2 0.00% 0.12% -0.65% 0.60% -0.19% -0.13%
Avg 0.55% 0.56% 0.41% 0.29% -0.13% 1.34%
SPX summary for Presidential Year 2 1954 - 2014
Avg -0.28% 0.16% 0.12% 0.14% -0.03% 0.20%
Win% 18% 56% 56% 56% 31% 44%
SPX summary for all years 1953 - 2017
Avg 0.07% -0.01% 0.19% -0.01% 0.00% 0.22%
Win% 48% 56% 58% 49% 48% 60%
Conclusion
The market is oversold and overdue for a bounce. The commencement of the bounce or rally will be signaled by a sharp reduction in the number of new lows
I expect the major averages to be higher on Friday February 16 than they were on Friday February 9.
Last weeks positive forecast was a miss.
By Mike Burk


