


The junior gold miners’ stocks have spent much of the past year grinding sideways near lows, sapping confidence and breeding widespread bearishness. The entire precious-metals sector has been left for dead, eclipsed by the dazzling taxphoria stock-market rally. But traders need to keep their eyes on the fundamental ball, so herd sentiment doesn’t mislead them. The juniors’ recent Q4 results proved quite strong.
Four times a year publicly-traded companies release treasure troves of valuable information in the form of quarterly reports. Required by securities regulators, these quarterly results are exceedingly important for investors and speculators. They dispel all the sentimental distortions surrounding prevailing stock-price levels, revealing the underlying hard fundamental realities. That serves to re-anchor perceptions.
Normally quarterlies are due 45 calendar days after quarter-ends, in the form of 10-Qs required by the SEC for American companies. But after the final quarter of fiscal years, which are calendar years for most gold miners, that deadline extends out up to 90 days depending on company size. The 10-K annual reports required once a year are bigger, more complex, and need fully-audited numbers unlike 10-Qs.
So it takes companies more time to prepare full-year financials and then get them audited by CPAs right in the heart of their busy season. The additional delay in releasing Q4 results is certainly frustrating, as that data is getting stale approaching the end of Q1. Compounding the irritation, some gold miners don’t actually break out Q4 separately. Instead they only report full-year results, lumping in and obscuring Q4.
I always wonder what gold miners that don’t report full Q4 results are trying to hide. Some Q4 numbers can be inferred by comparing full-year results to the prior three quarterlies, but others aren’t knowable if not specifically disclosed. While most gold miners report their Q4 and/or full-year results by 7 to 9 weeks after year-ends, some drag their feet and push that 13-week limit. That’s very disrespectful to investors.
All this unfortunately makes Q4 results the hardest to analyze out of all quarterlies. But delving into them is still well worth the challenge. There’s no better fundamental data available to gold-stock investors and speculators than quarterly results, so they can’t be ignored. They offer a very valuable true snapshot of what’s really going on, shattering all the misconceptions bred by the ever-shifting winds of sentiment.
The definitive list of elite junior gold stocks to analyze comes from the world’s most-popular junior-gold-stock investment vehicle. This week the GDXJ VanEck Vectors Junior Gold Miners ETF reported $4.5b in net assets. Among all gold-stock ETFs, that was second only to GDX’s $7.9b. That is GDXJ’s big-brother ETF that includes larger major gold miners. GDXJ’s popularity testifies to the great allure of juniors.
Unfortunately, this fame created major problems for GDXJ over the past couple years, severely hobbling its usefulness to investors. This ETF is quite literally the victim of its own success. GDXJ grew so large in the first half of 2016 as gold stocks soared in a massive upleg that it risked running afoul of Canadian securities laws. And most of the world’s smaller gold miners and explorers trade on Canadian stock exchanges.
Since Canada is the center of the junior-gold universe, any ETF seeking to own this sector will have to be heavily invested there. But once any investor including an ETF buys up a 20 percent+ stake in any Canadian stock, it is legally deemed to be a takeover offer that must be extended to all shareholders! As capital flooded into GDXJ in 2016 to gain junior-gold exposure, its ownership in smaller components soared near 20 percent.
Obviously, hundreds of thousands of investors buying shares in an ETF have no intention of taking over gold-mining companies, no matter how big their collective stakes. That’s a totally-different scenario than a single corporate investor buying 20 percent+. GDXJ’s managers should’ve lobbied Canadian regulators and lawmakers to exempt ETFs from that 20 percent takeover rule. But instead they chose an inferior, easier solution.
Related: Is Barrick Gold Close To Finding A Bottom?
Since GDXJ’s issuer controls the junior-gold-stock index underlying its ETF, it simply chose to unilaterally redefine what junior gold miners are. It rejiggered its index to fill GDXJ’s ranks with larger intermediate gold miners, while greatly demoting true smaller junior gold miners in terms of their ETF weightings. This controversial move defying many decades of convention was done stealthily behind the scenes to avoid outrage.
There’s no formal definition of a junior gold miner, which gives cover to GDXJ’s managers pushing the limits. Major gold miners are generally those that produce over 1m ounces of gold annually. For decades juniors were considered to be sub-200k-ounce producers. So 300k ounces per year is a very-generous threshold. Anything between 300k to 1m ounces annually is in the mid-tier realm, where GDXJ now traffics.
That high 300k-ounce-per-year junior cutoff translates into 75k ounces per quarter. Following the end of the gold miners’ Q4’17 earnings season in late March, I dug into the top 34 GDXJ components. That’s just an arbitrary number that fits neatly into the tables below. Although GDXJ included a staggering 73 component stocks in late March, the top 34 accounted for a commanding 80.5 percent of its total weighting.
Out of these top-34 GDXJ companies, only 4 primary gold miners met that sub-75k-ounces-per-quarter qualification to be a junior gold miner! Their quarterly production is highlighted in blue below, and they collectively accounted for just 8.1 percent of GDXJ’s total weighting. But even that is really overstated, as half of these are long-time traditional major silver miners that have started diversifying into gold in recent years.
GDXJ is inarguably now a pure mid-tier gold-miner ETF. That would be great if GDXJ was advertised as such. But it’s very misleading if investors still believe this dominant “Junior Gold Miners ETF” still gives exposure to junior gold miners. I suspect the vast majority of GDXJ shareholders have no idea just how radically its holdings have changed since early 2016, and how much it has strayed from its original mission.
I’ve been doing these deep quarterly dives into GDXJ’s top components for years now. In Q4’17, fully 31 of the top-34 GDXJ components were also GDX components! These ETFs are separate, a “Gold Miners ETF” and a “Junior Gold Miners ETF”. So, there’s no reason for them to own many of the same companies. In the tables below, I highlighted the rare GDXJ components not also in GDX in yellow in the weightings column.
These 31 GDX components accounted for 76.7 percent of GDXJ’s total weighting, not just its top 34. They also represented 32.2 percent of GDX’s total weighting. So over 3/4ths of the junior gold miners’ ETF is made up of nearly a third of the major gold miners’ ETF! These GDXJ components in GDX start at the 12th-highest weighting in that latter larger ETF and extend down to 44th. Do investors know GDXJ is mostly GDX gold stocks?
Fully 11 of GDXJ’s top 17 components weren’t even in this ETF a year ago in Q4’16. They alone now account for 36.6 percent of its total weighting. 16 of the top 34 are new, or 43.8 percent of the total. In the tables below, I highlighted the symbols of companies that weren’t in GDXJ a year ago in light blue. GDXJ has changed radically and analyzing its top components’ Q4’17 results largely devoid of real juniors is frustrating.
Nevertheless, GDXJ remains the leading “junior-gold” benchmark. So, every quarter I wade through tons of data from its top components’ 10-Qs or 10-Ks, and dump it into a big spreadsheet for analysis. The highlights made it into these tables. Blank fields mean a company did not report that data for Q4’17 as of this Wednesday. Companies have wide variations in reporting styles, data presented, and report timing.
In these tables the first couple columns show each GDXJ component’s symbol and weighting within this ETF as of this week. While many of these gold stocks trade in the States, not all of them do. So, if you can’t find one of these symbols, it’s a listing from a company’s primary foreign stock exchange. That’s followed by each company’s Q4’17 gold production in ounces, which is mostly reported in pure-gold terms.
Many gold miners also produce byproduct metals like silver and copper. These are valuable, as they are sold to offset some of the considerable costs of gold mining. Some companies report their quarterly gold production including silver, a construct called gold-equivalent ounces. I only included GEOs if no pure-gold numbers were reported. That’s followed by production’s absolute year-over-year change from Q4’16.
Next comes the most-important fundamental data for gold miners, cash costs and all-in sustaining costs per ounce mined. The latter determines their profitability and hence ultimately stock prices. Those are also followed by YoY changes. Finally, the YoY changes in cash flows generated from operations, GAAP profits, revenues, and cash on balance sheets are listed. There are a couple exceptions to these YoY changes.
Percentage changes aren’t relevant or meaningful if data shifted from positive to negative or vice versa, or if derived from two negative numbers. So, in those cases I included raw underlying numbers instead of weird or misleading percentage changes. This whole dataset offers a fantastic high-level read on how the mid-tier gold miners are faring today as an industry. Contrary to their low stock prices, they’re doing quite well.
After spending days digesting these GDXJ gold miners’ latest quarterly reports, it’s fully apparent their vexing low consolidation over the past year isn’t fundamentally righteous at all! Traders have abandoned this sector because the allure of the levitating general stock markets has eclipsed gold. That has left gold stocks exceedingly undervalued, truly the best fundamental bargains out there in all the stock markets!
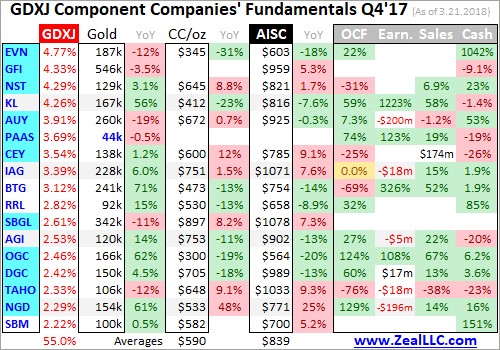
(Click to enlarge)
(Click to enlarge)
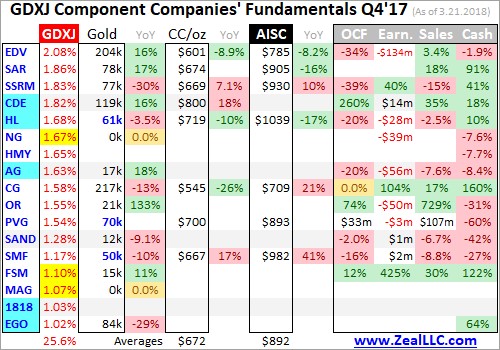
Once again the light-blue-highlighted symbols are new top-34 GDXJ components that weren’t included a year ago in Q4’16. And the meager yellow-highlighted weightings are the only stocks that were not also GDX components in late March! GDXJ is increasingly a GDX clone that offers little if any real exposure to true juniors’ epic upside potential during gold bulls. Sadly, this ETF has become a shadow of its former self.
VanEck owns and manages GDX, GDXJ, and the MVIS indexing company that decides exactly which gold stocks are included in each. With one company in total control, GDX and GDXJ should have zero overlap in underlying companies! GDX or GDXJ inclusion should be mutually-exclusive based on the sizes of individual miners. That would make both GDX and GDXJ much more targeted and useful for investors.
VanEck could greatly increase the utility and thus ultimate success of both GDX and GDXJ by starting with one combined list of the world’s better gold miners. Then it could take the top 20 or 25 in terms of annual gold production and assign them to GDX. That would run down near 150k or 105k ounces of quarterly production based on Q4’17 data. Then the next-largest 30 or 40 gold miners could be assigned to GDXJ.
The worst part of GDXJ now including mid-tier gold miners instead of real juniors is the latter are being relentlessly starved of capital. As investment capital flows into ETFs, they have to buy shares in their underlying component companies. That naturally bids their stock prices higher. But in GDXJ’s case, the capital investors intend to use to buy juniors is being stealthily diverted into much-larger mid-tier gold miners.
While there are still some juniors way down the list in GDXJ’s rankings, they collectively make up about 20 percent of this ETF’s weighting at best. Junior gold miners rely heavily on issuing shares to finance their exploration projects and mine builds. But when their stock prices are down in the dumps because no one is buying them, that is heavily dilutive. GDXJ is effectively strangling the very industry its investors want to own!
Since gold miners are in the business of wresting gold from the bowels of the Earth, production is the best place to start. These top-34 GDXJ gold miners collectively produced 4193k ounces in Q4’17. That rocketed 87 percent higher YoY, but that comparison is meaningless given the radical changes in this ETF’s composition since Q4’16. On the bright side, GDXJ’s miners do still remain much smaller than GDX’s.
GDX’s top 34 components, fully 19 of which are also top-34 GDXJ components, collectively produced 10,337k ounces of gold in Q4. So GDXJ components’ average quarterly gold production of 140k ounces excluding explorers was 57 percent lower than GDX components’ 323k average. In spite of GDXJ’s very-misleading “Junior” name, it definitely has smaller gold miners even if they’re way above that 75k junior threshold.
Despite GDXJ’s top 34 components looking way different from a year ago, these current gold miners are generally faring well on the crucial production front. 17 of these mid-tier gold miners enjoyed big average production growth of 30 percent YoY! Overall average growth excluding explorers was 12.2 percent YoY, which is far better than world mine production which slumped 1.7 percent lower YoY in Q4’17 according to the World Gold Council.
These elite GDXJ mid-tier gold miners are really thriving, with production growth way outpacing their industry. That will richly reward investors as sentiment normalizes. Smaller mid-tier gold miners able to grow production are the sweet spot for stock-price upside potential. With market capitalizations much lower than major gold miners, investment capital inflows are relatively larger which bids up stock prices faster.
With today’s set of top-34 GDXJ gold miners achieving such impressive production growth, their costs per ounce should’ve declined proportionally. Higher production yields more gold to spread mining’s big fixed costs across. And lower per-ounce costs naturally lead to higher profits. So production growth is highly sought after by gold-stock investors, with companies able to achieve it commanding premium prices.
There are two major ways to measure gold-mining costs, classic cash costs per ounce and the superior all-in sustaining costs per ounce. Both are useful metrics. Cash costs are the acid test of gold-miner survivability in lower-gold-price environments, revealing the worst-case gold levels necessary to keep the mines running. All-in sustaining costs show where gold needs to trade to maintain current mining tempos indefinitely.
Cash costs naturally encompass all cash expenses necessary to produce each ounce of gold, including all direct production costs, mine-level administration, smelting, refining, transport, regulatory, royalty, and tax expenses. In Q4’17, these top-34 GDXJ-component gold miners that reported cash costs averaged just $618 per ounce. That was actually up a slight 0.5 percent YoY, so the higher production failed to force costs lower.
This was still quite impressive, as the mid-tier gold miners’ cash costs were only a little higher than the GDX majors’ $600. That’s despite the mid-tiers each operating fewer gold mines and thus having fewer opportunities to realize cost efficiencies. Traders must recognize these mid-sized gold miners are in zero fundamental peril as long as prevailing gold prices remain well above cash costs. And $618 gold ain’t happening!
Way more important than cash costs are the far-superior all-in sustaining costs. They were introduced by the World Gold Council in June 2013 to give investors a much-better understanding of what it really costs to maintain gold mines as ongoing concerns. AISC include all direct cash costs, but then add on everything else that is necessary to maintain and replenish operations at current gold-production levels.
These additional expenses include exploration for new gold to mine to replace depleting deposits, mine-development and construction expenses, remediation, and mine reclamation. They also include the corporate-level administration expenses necessary to oversee gold mines. All-in sustaining costs are the most-important gold-mining cost metric by far for investors, revealing gold miners’ true operating profitability.
In Q4’17, these top-34 GDXJ components reporting AISCs averaged just $855 per ounce. That only rose 0.1 percent YoY, effectively dead flat, despite the new mix of GDXJ components. That also compares very favorably with the GDX majors, which saw nearly-identical average AISCs at $858 in Q4. The mid-tier gold miners’ low costs prove they are faring far better fundamentally today than their low stock prices imply.
All-in sustaining costs are effectively this industry’s breakeven level. As long as gold stays above $855 per ounce, it remains profitable to mine. At Q4’s average gold price of $1276, these top GDXJ gold miners were earning big average profits of $421 per ounce last quarter! That equates to fat profit margins of 33 percent, levels most industries would kill for. The mid-tier gold miners aren’t getting credit for that today.
Unfortunately given its largely-junior-less composition, GDXJ remains the leading benchmark for junior gold miners. In Q4’17, this ETF averaged $32.62 per share. That was down a considerable 10.2 percent from Q4’16’s average of $36.34. Investors have largely abandoned gold miners because they are captivated by the extreme taxphoria stock-market rally since the election. Yet gold-mining profits certainly didn’t justify this.
A year ago in Q4’16, the top-34 GDXJ components at that time also reported average all-in sustaining costs of $855 per ounce. With gold averaging $1218 then which was 4.6 percent lower, that implies the mid-tier gold miners were running operating profits of $363 per ounce. Thus Q4’17’s $421 surged 16.0 percent YoY, a heck of a jump! Yet the mid-tier gold miners’ stock prices irrationally slumped substantially lower.
Gold miners offer such compelling investment opportunities because of their inherent profits leverage to gold. Gold-mining costs are largely fixed during mine-planning stages, when engineers and geologists decide which ore to mine, how to dig to it, and how to process it. The actual mining generally requires the same levels of infrastructure, equipment, and employees quarter after quarter regardless of gold prices.
With gold-mining costs essentially fixed, higher or lower gold prices flow directly through to the bottom line in amplified fashion. This really happened in GDXJ over the past year despite its radical changes in composition. A 4.8 percent gold rally in quarterly-average terms catapulted operating profits 16.0 percent higher, or 3.3x. That’s right in line with the typical leverage of gold-mining profits to gold prices of several times or so.
But this strong profitability sure isn’t being reflected in gold-stock prices. GDXJ shouldn’t have been lower in Q4’17 with mining profits much higher. The vast fundamental disconnect in gold-stock prices today is absurd and can’t last forever. Sooner or later investors will rush into the left-for-dead gold stocks to bid their prices far higher. This bearish-sentiment-driven anomaly has grown more extreme in 2018.
Since gold-mining costs don’t change much quarter-to-quarter regardless of prevailing gold prices, it’s reasonable to assume the top GDXJ miners’ AISCs will largely hold steady in the current Q1’18. And it’s been a strong quarter for gold so far, with it averaging over $1328 quarter-to-date. If the mid-tier gold miners’ AISCs hold near $855, that implies their operating profits are now running way up near $473 per ounce.
That would make for a massive 12.4 percent QoQ jump in earnings for the mid-tier gold miners in this current quarter! Yet so far in Q1 GDXJ is languishing at an average of just $32.88, flatlined from Q4 where gold prices and mining profits were considerably lower. The mid-tier gold miners’ stocks can’t trade as if their profits don’t matter forever, so an enormous mean-reversion rally higher is inevitable sometime soon.
And that assumes gold prices merely hold steady, which is unlikely. After years of relentlessly-levitating stock markets thanks to extreme central-bank easing, radical gold underinvestment reigns today. As the wildly-overvalued stock markets inescapably sell off on unprecedented central-bank tightening this year, gold investment will really return to favor. That portends super-bullish-for-miners higher gold prices ahead.
The impact of higher gold prices on mid-tier-gold-miner profitability is easy to model. Assuming flat all-in sustaining costs at Q4’17’s $855 per ounce, 10 percent, 20 percent, and 30 percent gold rallies from this week’s levels would lead to collective gold-mining profits surging 45 percent, 77 percent, and 108 percent! And another 30 percent gold upleg isn’t a stretch at all. In the first half of 2016 alone after the previous stock-market correction, gold soared 29.9 percent.
GDXJ skyrocketed 202.5 percent higher in 7.0 months in largely that same span! Gold-mining profits and thus gold-stock prices surge dramatically when gold is powering higher. Years of neglect from investors have forced the gold miners to get lean and efficient, which will really amplify their fundamental upside during the next major gold upleg. The investors and speculators who buy in early and cheap could earn fortunes.
Given the radical changes in GDXJ’s composition over the past year, normal year-over-year comparisons in key financial results simply aren’t meaningful. The massive rejiggering of the index underlying GDXJ didn’t happen until Q2’17, so it will be a couple quarters yet until results finally grow comparable again. But in the meantime, here are the apples-to-oranges reads on the GDXJ components’ key financial results.
The cash flows generated from operations by these top-34 GDX components rocketed 104.5 percent higher YoY to $1743m. That helped boost their collective cash balances by 53.9 percent YoY to $6577m. Sales were up 102.6 percent YoY to $4282m, roughly in line with the 87.4 percent gold-production growth. But again, GDXJ was way different a year ago, so this impressive growth merely reflects bigger mid-tier gold miners replacing true juniors.
As long as OCFs remain massively positive, the gold mines are generating much more cash than they cost to run. That gives the gold miners the capital necessary to expand existing operations and buy new deposits and mines. Given how ridiculously low gold-stock prices are today, you’d think the gold miners are hemorrhaging cash like crazy. But the opposite is true, showing how silly this bearish herd sentiment is.
Unfortunately, the GAAP earnings picture looked vastly worse. These top-34 GDXJ gold miners reporting Q4 earnings collectively lost $317m, compared to a minor $2m profit in Q4’16. While that certainly looks like a disaster, it’s heavily skewed. Excluding 3 big mid-tier gold miners that reported huge losses in Q4, the other 11 of these top GDXJ gold miners reporting earnings actually earned an impressive $212m in profits. Related: Google Invests $300 Million To Combat Fake News
Yamana Gold, New Gold, and Endeavour Mining suffered huge $200m, $196m, and $134m losses in Q4’17. In each case these resulted from large impairment charges. As mines are dug deeper and gold prices change, the economics of producing this metal change too. That leaves some of the mid-tier gold miners’ individual mines worth less going forward than the amount of capital invested to develop them.
So they are written off, resulting in big charges flushed through income statements that mask operating profits. But these writedowns are something of an accounting fiction, non-cash expenses not reflective of current operations. They are mostly isolated one-time events as well, not representing earnings trends. As gold continues to march higher in its young bull, impairment charges will vanish as mining economics improve.
So overall the mid-tier gold miners’ fundamentals looked quite strong in Q4’17, a stark contrast to the miserable sentiment plaguing this sector. Gold stocks’ vexing consolidation over the past year or so isn’t the result of operational struggles, but purely bearish psychology. That will soon shift as stock markets inevitably roll over and gold surges, making the beaten-down gold stocks a coiled spring overdue to soar dramatically.
Given GDXJ now diverting most of its capital inflows into larger mid-tier gold miners that definitely aren’t juniors, you won’t find sufficient junior-gold exposure in this now-mislabeled ETF. Instead traders should prudently deploy capital in the better individual mid-tier and junior gold miners’ stocks with superior fundamentals. Their upside is vast and would trounce GDXJ’s even if it was still working as advertised.
The bottom line is the mid-tier gold miners now dominating GDXJ enjoyed strong fundamentals in their recently-reported Q4 results. While GDXJ’s radical composition changes since last year muddy annual comparisons, today’s components mined lots more gold at dead-flat costs. These miners continued to earn fat operating profits while generating strong cash flows. Sooner or later stock prices must reflect fundamentals.
As gold itself continues mean reverting higher, these mid-tier gold miners will see their profits soar due to their big inherent leverage to gold. GDXJ now offers excellent exposure to mid-tier gold miners, which will see gains well outpacing the majors. All it will take to ignite gold stocks’ overdue mean-reversion rally is gold investment demand returning. The resulting higher gold prices will attract investors back to gold miners.
By Adam Hamilton
More Top Reads From Safehaven.com:


