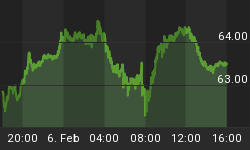
The opening bell on Wall Street was tolling for Toll Bros., the upscale homebuilder, who announced prior to the opening of trading that its orders plunged 29% in the three months ended January 31. The homebuilder cut its forecast for sales for the second time in three months. As this is being written at about 2:30 pm EST, Toll Bros. stock was trading just under $30 a share, or down about 4% from Monday's close. As the Chart 1 shows, after going through the roof in the first half of 2005, Toll Bros. stock price topped out at $58 and change on July 20, and has been falling toward the ground floor ever since.
Chart 1
It is not clear that we economists are able to contribute much toward accurately forecasting the fate of a stock, but it does seem as though the behavior of a stock can aid economists in forecasting the behavior of the economy or, at least, a sector of the economy. Chart 2 shows that the year-overyear percent change in new home sales peaked in July - coincidentally with the peak in the price of Toll Bros. stock.
Chart 2
Toll Bros. was not the only one with a downbeat forecast about new home sales today. Also, the National Association of Realtors predicted that new and existing home sales would fall by 8.5% and 4.7%, respectively, this year. A fall in sales is usually what happens to something that gets very expensive. And, make no mistake, houses have gotten very expensive. This is one of the things illustrated in Chart 3. The folks at Wells Fargo were kind enough to construct something akin to a housing affordability index. Their homebuilders housing "opportunity" index measures the percentage share of homes sold that could be considered affordable to a family earning the median income. The latest observation (Q3:2005) is 43.2% -- the lowest in the 15-year history of the series. The other thing shown in Chart 3 is the weighted-average mortgage interest rate. Despite the fact that the mortgage rate is near a 15-year low, this measure of housing affordability is at a 15-year low. The rapid rise in home prices relative to family income has rendered home purchases less affordable. A related measure of this is shown in Chart 4. The market value of residential real estate has risen to a record high 211% of disposable personal income.
Chart 3
Chart 4
The developing softness in the housing market is likely to have a significant negative impact on the economy as a whole. Some analysts have seen Asha Bangalore's 43% and raised her to 50%. That is, building on the seminal research conducted by Asha, some economists have attributed about half of the new jobs created in this economy since the end of 2001 to the boom in housing. Yesterday, I noted that households spent a record $471 billion more than they earned after taxes in 2005. Extracting equity from their appreciating home values was one of the factors enabling households to do this. If housing is weakening, so, too, will home-price appreciation. This means that those personal ATMs will not be refilling as rapidly as they had been. Finally, in the first three quarters of 2005, one hundred percent of the increase in household net worth was the result of asset-price appreciation. And 59% of the asset price appreciation came from residential real estate.
Forget about GM. The new mantra is: As goes housing, so goes the nation - or, at least, the nation's economy.


