


This week we look at an interesting index of greed and fear, look at the yield curve and the new 30 year Treasury bond, the latest unemployment numbers and a lot more. What do they tell us? Is there a theme or at least a rhyme? Or is it all random noise sent by the market gods to lull us back into the mistakes of the past?
Greed by Four Lengths
The markets are a race between greed and fear. Right now Greed is looking like Seabiscuit beating War Admiral by four lengths at the stretch. (As an aside, you can read the greatest descriptions of that race - and one of the truly great sports columns of all time - by the incomparable Grantland Rice at http://www.secondrunning.com/seabiscuit_war%20admiral.htm. That man could stir the soul with his words, and this was Rice at his best.)
Good friend James Montier over at Dresdner Kleinwort Wasserstein in London has been tracking his own measure of fear and greed for the last few years. It is a fairly simple measurement but it does show some very interesting patterns. He admittedly has not looked at the index for awhile (it is rather like watching paint dry on a week to week basis), so he dusted off his old data files and updated his index. What a difference a year makes. The index has only reached this level of greed in September of 1987 and May of 1996.
What does it measure? Risk appetite. "It is really a measure of relative risk adjusted momentum between global equities and bonds. When the risk adjusted performance of equities is high relative to the risk adjusted performance of bonds, then investors start to forget about the concept of risk altogether; they become totally focused on return. Irrational exuberance reigns (shown as a reading of above 1 in the chart below)."
"In contrast, when bonds have performed well in risk adjusted terms relative to equities, investors tend to forget that things will generally get better at some point, so this creates the 'end of the world is nigh' kind of feeling (a reading of -2 in the chart below). Effectively, the measure captures the tendency towards extrapolation of the recent past/current situation into the indefinite future. Thus it serves as a contrary indicator."
Let's look at the actual chart:

The first thing my astute readers will notice is that this does not seem like a reliable indicator. I mean, in 1996 it went off the charts but the markets were still going up. Of course, it seems to nail the bottoms, but we are nowhere near a bottom.
So why even bring it up? Because we have other flashing lights going off in our list of indicators. As we discussed for the last two weeks, real hourly earnings and real consumer spending are slowing down, which is a very good indicator of a future slowing of the US economy. And the yield curve is starting to invert (more later). We are getting signals that should make investors more cautious, yet they are becoming even less so!
Neither consumer spending nor the yield curve were showing "issues" in 1996. On balance, greed was a good thing back then.
Extremes of greed and fear are excellent contrarian indicators, especially when coupled with other data that corroborates them. As we will see, there are multiple flashing lights.
Employment Growth Starts to Peak
At about 1:30 on Thursday, Chicago Fed President Moskow said the low jobless rate may put upward pressure on wages. That did not help the bond market, which started to drop, even after a very robust 30 year Treasury bond auction. But is the job rate really all that low?
Barry Ritzholt brought the following chart to my attention. It looks like employment growth when measured on a year-over-year basis is beginning to peak. Yes, employment is steadily rising each month, but the growth from the previous year looks like it is going flat. Again, this is not a sure sign of a slowdown, but an overall economic slowdown often follows such a slowing of the rate of growth in employment.
In general, employment is a lagging indicator. You will see employment rising overall even as a bear market and an economic slowdown are in progress. But before unemployment rises, the rate of growth slows down and then starts to fall. It is not falling yet, but it has certainly gone flat. It is just another warning indicator that is starting to flash red.

I should also note that employment seems to be peaking at a far lower level than any time in the last 46 years. Growth is only about 1.6%.
Paul Kasriel of Northern Trust makes another good point. Right now the official unemployment rate is 4.7%, which is an excellent number. But it is also misleading. There are a number of people who are simply not looking for jobs. Since they are not participating in the "job market" the Bureau of Labor Statistics does not count them as unemployed. This is called the participation rate, and it has been dropping since the bottom of the last recession. As Kasriel somewhat wryly notes:
"Although there have been cycle lows in the unemployment rate beneath 4.7%, there have been a number of unemployment rate nadirs above 4.7%. Yes, but. But there has never been an expansion cycle in the past 45 years in which the participation rate (those actually in the labor force as a percent of those that could be in the labor force) trended lower save for the current one (see the chart below!). Had the labor participation rate risen in a normal cyclical fashion, today's unemployment rate would be considerably higher. Katherine Bradbury, an economist at the Boston Fed, discussed this unique cyclical behavior of the participation rate only to have the big guns of Federal Reserve Board economists discredit her 'politically-incorrect' study. Kind of makes you wonder why the 12 Fed District Banks even have economic research departments given that the font of all knowledge resides with Board economists."

Kasriel also noted that although real hourly wages did move up last month, that can be misleading because of the way the average is calculated. Of more significance is the Employment Cost Index, which measures total employee costs, including benefits. That year-over-year indicator is slowing rapidly and is touching a ten year low in its rate of growth.
As noted above, Chicago Fed president Moskow says that the low jobless rate may put upward pressure on wages. He also has access to the same data Kasriel and others have, which says that employee costs are not rising, and thus not a threat to inflation.
My guess, and it is only that, is that he and other Fed members are making a case for at least one and possibly two more rate increases. That will take the Fed funds rate to 4.75% or 5%. But Paul McCulley argues, and I agree, that the Fed funds rate is already past neutral. All of the items I mentioned above suggest the economy may be starting to slow. While I believe that last quarter's GDP number will be revised upward and possibly sharply upward, it will still be well below 3%. In a slowing economy, you do NOT need to tighten. That will only slow things down more! Here's what Paul says:
"In the fullness of time, we believe strongly that today's Fed funds rate will prove to be not neutral, but restrictive, as evolving weakness in residential property activity self-feeds in reflexive fashion. To be sure, time may not yet be cyclically full. But, ironically, the more the Fed pushes the conventional Taylor Rule envelope, the greater the probability that our secular forecast is right!
"When the cyclical turn comes, it will be a wicked turn, our guts say, as conventional policy gives way to unconventional property market weakness. It will be time to think and act unconventionally..."
You can read McCulley's very fine piece at http://www.pimco.com/LeftNav/Late+Breaking+Commentary/FF/2006/FF+February+2006.htm.
30 year Treasuries Hit the Yield Curve
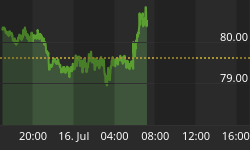
Thursday saw the re-emergence of the 30 year Treasury. Before the auction results were released, the yield was 4.703%. They bonds closed at 4.64% on Thursday, which shows strong after market demand. It also brought the 30 year below the six-month rate.
No let's go the chart as of the close on Friday:

The orange line is where the Friday started. The green line is where it ended. Notice the big drop in the 30 year on top of the drop the day before! If - when! - the Bernanke Fed takes the Fed funds rate to 4.75% or even (gasp!) 5%, we could - will - see a full inversion across the yield curve.
In fact, that could happen even sooner. There is only a 2 basis points spread between the 3 month bill and the 30 year bond.
This Time Its Different
Of course, everyone is going to argue that this time it is different. The argument is that foreign central banks are buying so much US government debt that they are depressing prices. If not for them, interest rates at the long end would be 50-100 basis points higher. So, add in that factor and the yield curve is not inverted. Yeah, right. But the graph will say otherwise.
In 2000, there was a very logical argument that "it is different this time." The argument was that with government surpluses actually reducing the amount of outstanding government debt, there was not enough supply of 10-20-30 year bonds and that was the cause of the inverted yield curve. Maybe that was true, but a recession did show up on time. As an indicator, it turned out not to be different at all.
(Was it only five years ago Greenspan worried about a time when there would be no government debt? Republicans to the rescue! How utterly and truly sad. The party of small government has increased government spending by $1 Trillion (with a Capital T!) in just 6 years. And it wasn't the tax cut. Revenues are way, way up. We are just growing spending even faster.)
I am not comfortable with the "this time it's different" argument. Of course, it's different this time. There are always things that are different. But that does not mean that there is not a rhythm to the markets that the yield curve might be showing us, just as it has before every recession and slowdown.
Again, the yield curve is not, nor is any other data, telling us that a recession is in the cards. It is merely hinting a slowdown at this time. That may in fact be all we get, like we had in the mid-80s and mid-90s. That would be my bet, or at least hope, right now.
But from an equity investor position, a real slowdown will still produce a bear market - unless the world is well and truly turned upside down. So, let's close with some thoughts from a few friends who are also thinking about the same topic. First, from Montier, whose work we started with:
"Regular readers with long memories may recall that back in 2003 we created a series of tactical asset allocation models based on a combination of valuation and momentum (based on John Hussman's work). I used to comment on these models regularly. However, frankly I got bored with writing about them once a month. However, that doesn't mean that they have slinked off into the spreadsheet graveyard. They are still very much alive and well. For three of the four countries that we run the models for, we are getting sell equity signals - US, Japan and Germany. Only the UK continues to generate a condition III buy signal (unfavourable valuation, but good momentum). The combination of a very extended greed reading and a series of sell signals from our TAA models all suggest that now is the time that investors should be seeking to reduce beta in all its forms within their portfolios."
Good friend Dennis Gartman follows a series of data comparing the ratio between coincident to lagging indicators, which has also been a fairly reliable indicator of economic slowdowns. He wrote us this morning:
"Oft times our best thoughts come to us while flying overseas or far across country. Perhaps 'tis the bad air that one is forced to breathe on airplanes, or perhaps it is the mystical distance that one feels away from the vagaries of the markets when flying at 35,000 feet. None the less, while traveling last night to Vancouver it struck us: yesterday's action on the US stock market was perhaps the worst we have seen in many, many years. The leaders (as we have referred to them, The Generals) such as Google and Apple and US Steel and Phelps Dodge all opened sharply higher, broke very modest downtrend lines... and then collapsed... hard.
"All of these Generals traced out massive outside reversals, or technical patterns very similar, in the course of the past week or so. In the case of Google, the pre-imminent stock of the past two years, not only has it 'reversed' in weekly terms, it has gapped lower and it has left those gaps fully and rather visibly intact. The steel companies, the prosaic Generals on the upside, too have gapped lower in many cases, and in the case of US Steel, is almost certain to trace out a weekly reversal to the downside unless it rallies violently and materially today.
"As we looked through a listing of various stocks we follow, each one... every single one... looks ominously bearish, and from our dispassionate place above the Rockies we are more concerned about the possibility of a near bear market than we have been in a very, very long while. With our favorite economic indicator, the Ratio of the Coincident to Lagging Indicators, having turned down late last year, suggesting that a recession looms on the horizon out in the 3rd or 4th quarter of this year, it would be historically reasonable... even historically well precedented... for share prices to make their highs now. We think it is time to fly a flag of caution at the very least, and it may soon be the time to fly a bearish flag."
The normally quite bullish team at GaveKal is starting to sound, well, almost bearish. After noting the rather poor housing statistics that came out this week, they write:
"With a huge inventory of houses already completed, we expect declining confidence in housing to translate into some mild declines in prices and a precipitous fall in construction activity, which has been the fastest-growing major sector of the US economy and a big source of incremental incomes and jobs. The upshot is that consumer spending will suffer both from falling construction incomes and, much more importantly, from a diminishing willingness to borrow and spend on the basis of home equity loans. The MBA mortgage index has already dipped significantly, as mentioned above.
"If we are right in our view that consumer front-end of the US economy is already slowing, the production back-end is bound to follow in the next few months. The only question, in our view, is when the firm evidence will emerge. Given the inevitable lags between events in the real economy and the publication of statistics, the earliest date to expect conclusive evidence of a slowdown is probably mid- March (i.e.: the publication date for February statistics) - and realistically it will not be until mid-May that the markets or the Fed will be confident that any weakening is more than just a random statistical blip.
"These lags mean that the Fed is almost certain to raise interest rates to 4.75% at Ben Bernanke's first meeting in the chair on March 28 and quite likely to follow with a further tightening to 5% on May 10. This degree of tightening is not yet discounted in the markets and it would produce a steeply inverted yield curve if the 10-year yield stayed anywhere near its current level of 4.3% (our premise). The upshot could be a pretty ugly situation for all cyclical assets, with statistics unexpectedly weakening, corporate earnings sure to follow, the Fed overshooting and the bond market apparently pointing to recession.
"In our view, such anxiety about recession will turn out to be a head-fake, since the low level of bond yields and inverted yield curve will be a function of the Asian savings surplus, rather than cyclical concerns. But that is only our opinion. In all likelihood, the perma-bears would come out of hibernation in response to weak US figures and would gain far more attention with their roaring predictions of recession, than we could possibly attract with our more subtle views about amid-cycle slowdown and a rebound in 2007.
"In short, the summer should present some excellent buying opportunities for equity investors, but first we expect to see some bad news on the economy, attacks on Bernanke for overdoing the monetary tightening - and a market correction of more than a few percent..."
London and The Millennium Wave
Saturday morning I leave for London. It has been so warm in Texas this winter; this will be my first real cold weather. Or maybe I can bring some warm weather with me to London. I will be there through Wednesday and then back to Dallas on Thursday. A few days to get back on local time and then I start my next book in earnest.
It will be called The Millennium Wave, and will look at the waves of accelerating change we are going to see over the next 20 years, both good and bad. A month ago I asked if anyone wanted to work with me on some of the research as an unpaid volunteer just for the fun of it, and the mention of your name in the acknowledgements. I was very pleasantly surprised when I got 20 or so responses, and especially about the quality of people offering to help.
What we have done is break the research into 8 digestible tracks. We have created a password protected website where teams can work on one track, sharing their thoughts and information they dig up, and hopefully finding more than I ever could while sifting through the data, and letting the good stuff come to the surface. I will interact and follow up.
I am pretty excited about this collaborative effort. If anyone else wants to get involved, drop me a note and Harry Ward, my associate, will get back to you.
Being really bold, the book is due out late this fall. I have been thinking about and gathering material on this topic for six years. This is one deadline I am really going to try and make, which is why I have curtailed my travel over the next five months. I really only have a few speeches in May and June. Besides, I just saw the proposed cover and for once I liked it. If you have a great cover, you just gotta do the book, right?
It will be a time challenge as the normal work of researching hedge funds, investments and other client interaction all has to be done, so I see a few long nights, but it is on a topic I love, so hopefully it will not seem too much like work.
And let's close with theee words from Grantland Rice on Seabiscuit and War Admiral. The link is at the beginning of the letter. I suggest you read it. His prose will stir even the hardest of bitten souls.
"The race, they say, isn't to the swift. But it is always to the swift and the game. It so happened that Seabiscuit had these two important qualities in deep abundance. War Admiral could match neither flying feet nor fighting heart. Man o' War's brilliant son hung on with all he had until it came to the big showdown -- to the point when the hard-way thoroughbred, the horse from the wrong side of the track, began really to run."
Have a great week.
Your packing his coat and gloves analyst,


