


The good news is:
• There has not been a significant build up of new lows and downsidevolume appears to be abating.
Short term
The chart below covers the period from late last September with dashed vertical lines on the 1st trading day of each month. The NASDAQ composite (OTC) is shown in red and Accutrack (AT), a FastTrack relative strength indicator is shown in black. AT is comparing the strength of the Russell 2000 (R2K) and the S&P 500 (SPX). When the market is healthy the R2K outperforms the SPX and AT moves upward. AT turned sharply downward last week.

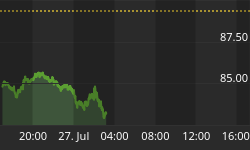
The NASDAQ new high indicator ( OTC NH) is a 10% trend (19 day EMA) of NASDAQ new highs. The chart below covers the period from September through last Friday. The OTC is shown in red and OTC NH is shown in green.
The indicator fell sharply all week.
Interestingly, the highest number of new highs for the week occurred on Thursday, a down day for the OTC.
As of Friday the value of the indicator was 136 so more than 136 new highs will move the indicator upward while less than 136 will move the indicator downward.

Intermediate term
Summation indices (SI) are running totals of oscillator values.
The chart below covers the period from last September through last Friday showing the OTC in red and SI's calculated from advancing - declining issues, new highs - new lows and upside - downside volume. All of the SI's are heading downward, however the volume SI appears to be flattening.

The next chart covers the period from last April through last Friday. It shows the OTC in red and momentum of downside volume in blue.
The indicator usually moves in the same direction as prices, often with a little lead and it turned upward last week.

Seasonality
Next week can be viewed from two seasonal perspectives.
1. It is the week before options expiration.
2. It is the week before the Presidents day Holiday.
Options were not an issue prior to the mid 1980's and since the mid 1980's performance during the week has improved.
The first two tables show the daily performance of the indices during the week prior to the 3rd Friday in February during the 2nd year of the Presidential Cycle. OTC data runs from 1966 - 2002 and SPX from 1930 - 2002. There are summaries for both Presidential Year 2 and all years.
Presidents day is the 3rd Monday in February and is a combination of Lincoln's and Washington's birthdays; it was first observed in 1971.
The second two tables show the performance of the OTC and SPX during the week before President's day during the 2nd year of the Presidential. There are summaries for both Presidential Year 2 and all years.
From a seasonal perspective, next week has a modest negative bias.
Report for the week before options expiration Friday during Feb
The number following the year is the position in the presidential cycle.
| OTC Presidential Year 2 | ||||||
| Year | Mon | Tue | Wed | Thur | Fri | Totals |
| 1966-2 | 0.23% | -0.22% | -0.47% | 0.50% | 0.13% | 0.19% |
| 1970-2 | -0.17% | -0.10% | -0.17% | 0.67% | 0.02% | 0.26% |
| 1974-2 | -1.16% | -0.69% | -0.46% | 0.14% | 0.85% | -1.32% |
| 1978-2 | -0.23% | -0.54% | -0.21% | -0.38% | 0.08% | -1.29% |
| 1982-2 | 0.00% | -0.99% | 0.30% | 0.07% | -0.40% | -1.02% |
| Avg | -0.33% | -0.51% | -0.20% | 0.20% | 0.14% | -0.64% |
| 1986-2 | 0.00% | 0.61% | 0.15% | 0.06% | 0.72% | 1.54% |
| 1990-2 | -0.57% | -0.15% | 0.19% | 0.72% | -0.14% | 0.04% |
| 1994-2 | 0.52% | 0.59% | 0.32% | -0.30% | -0.18% | 0.95% |
| 1998-2 | 0.00% | -0.41% | 0.72% | 0.66% | 0.06% | 1.04% |
| 2002-2 | 1.53% | -0.67% | 1.36% | -0.85% | -2.00% | -0.64% |
| Avg | 0.49% | 0.00% | 0.55% | 0.06% | -0.31% | 0.59% |
| OTC summary for Presidential year 2 1966 - 2002 | ||||||
| Avg | 0.02% | -0.26% | 0.17% | 0.13% | -0.09% | -0.02% |
| Win% | 43% | 20% | 60% | 70% | 60% | 60% |
| OTC summary for all years 1963 - 2005 | ||||||
| Avg | 0.07% | -0.34% | 0.01% | -0.04% | -0.34% | -0.63% |
| Win% | 63% | 50% | 45% | 55% | 36% | 45% |
| SPX Presidential Year 2 | ||||||
| Year | Mon | Tue | Wed | Thur | Fri | Totals |
| 1930-2 | 0.56% | 0.09% | -0.90% | -1.86% | 1.24% | -0.88% |
| 1934-2 | 0.00% | 0.63% | 0.62% | 1.95% | 0.26% | 3.46% |
| 1938-2 | 0.82% | -1.18% | -0.18% | 2.00% | -1.17% | 0.29% |
| 1942-2 | -0.35% | -1.85% | -0.12% | 0.24% | -0.35% | -2.43% |
| 1946-2 | -0.76% | 0.00% | -1.43% | 0.61% | 1.93% | 0.36% |
| 1950-2 | 0.00% | -0.93% | 0.00% | -0.41% | 0.94% | -0.40% |
| 1954-2 | -0.31% | -0.88% | 0.19% | 0.39% | -0.15% | -0.76% |
| 1958-2 | -0.53% | 0.15% | -0.05% | -0.58% | -0.07% | -1.09% |
| 1962-2 | -0.03% | -0.01% | -0.04% | 0.45% | -0.21% | 0.16% |
| Avg | -0.41% | -0.42% | -0.33% | 0.09% | 0.49% | -0.35% |
| 1966-2 | -0.17% | -0.51% | -0.01% | -0.54% | -0.27% | -1.50% |
| 1970-2 | -0.08% | -0.12% | 1.24% | 0.37% | 0.31% | 1.72% |
| 1974-2 | -1.81% | 0.31% | 0.04% | -0.03% | 1.45% | -0.04% |
| 1978-2 | -0.24% | -0.91% | -0.24% | -0.84% | -0.14% | -2.37% |
| 1982-2 | 0.00% | -0.28% | -0.32% | 0.11% | -0.53% | -1.02% |
| Avg | -0.58% | -0.30% | 0.14% | -0.19% | 0.17% | -0.64% |
| 1986-2 | 0.00% | 1.22% | -1.21% | 1.12% | 1.08% | 2.21% |
| 1990-2 | -1.06% | 0.28% | 0.30% | 0.87% | -0.65% | -0.26% |
| 1994-2 | 0.01% | 0.49% | 0.06% | -0.52% | -0.56% | -0.53% |
| 1998-2 | 0.00% | 0.26% | 0.91% | -0.37% | 0.57% | 1.38% |
| 2002-2 | 1.43% | -0.40% | 0.99% | -0.18% | -1.10% | 0.75% |
| Avg | 0.13% | 0.37% | 0.21% | 0.18% | -0.13% | 0.71% |
| SPX summary for Presidential Year 2 1930 - 2002 | ||||||
| Avg | -0.18% | -0.20% | -0.01% | 0.15% | 0.14% | -0.05% |
| Win% | 29% | 44% | 44% | 53% | 42% | 42% |
| SPX summary for all years 1928 - 2005 | ||||||
| Avg | 0.05% | -0.10% | 0.07% | 0.05% | 0.06% | 0.11% |
| Win% | 50% | 48% | 51% | 49% | 48% | 54% |
Report for 5 days prior to the Friday before Presidents day.
| OTC Presidential Year 2 | ||||||
| Day5 | Day4 | Day3 | Day2 | Day1 | Totals | |
| 1974-2 | -1.16% 1 | -0.69% 2 | -0.46% 3 | 0.14% 4 | 0.85% 5 | -1.32% |
| 1978-2 | -0.23% 1 | -0.54% 2 | -0.21% 3 | -0.38% 4 | 0.08% 5 | -1.29% |
| 1982-2 | -1.90% 1 | -1.15% 2 | 0.25% 3 | -0.39% 4 | 0.15% 5 | -3.04% |
| 1986-2 | 0.64% 1 | 0.15% 2 | 0.39% 3 | 0.55% 4 | 0.58% 5 | 2.32% |
| 1990-2 | -0.57% 1 | -0.15% 2 | 0.19% 3 | 0.72% 4 | -0.14% 5 | 0.04% |
| 1994-2 | 0.52% 1 | 0.59% 2 | 0.32% 3 | -0.30% 4 | -0.18% 5 | 0.95% |
| 1998-2 | -0.24% 1 | 1.10% 2 | -0.02% 3 | 0.33% 4 | -0.23% 5 | 0.95% |
| 2002-2 | 1.53% 1 | -0.67% 2 | 1.36% 3 | -0.85% 4 | -2.00% 5 | -0.64% |
| Avg | 0.38% | 0.20% | 0.45% | 0.09% | -0.39% | 0.73% |
| OTC summary for Presidential Year 2 1974 - 2002 | ||||||
| Averages | -0.18% | -0.17% | 0.23% | -0.02% | -0.11% | -0.25% |
| %Winners | 38% | 38% | 63% | 50% | 50% | 50% |
| MDD 2/11/1982 3.17% -- 2/15/2002 2.83% -- 2/13/1974 2.30% | ||||||
| OTC summary for all years 1971 -2005 | ||||||
| Averages | 0.04% | -0.10% | 0.38% | 0.14% | -0.12% | 0.33% |
| %Winners | 46% | 51% | 71% | 54% | 46% | 60% |
| SPX Presidential Year 2 | ||||||
| Day5 | Day4 | Day3 | Day2 | Day1 | Totals | |
| 1974-2 | -1.81% 1 | 0.31% 2 | 0.04% 3 | -0.03% 4 | 1.45% 5 | -0.04% |
| 1978-2 | -0.24% 1 | -0.91% 2 | -0.24% 3 | -0.84% 4 | -0.14% 5 | -2.37% |
| 1982-2 | -2.00% 1 | -0.83% 2 | 0.86% 3 | -0.20% 4 | -0.04% 5 | -2.21% |
| 1986-2 | 0.78% 1 | -0.15% 2 | 0.02% 3 | 0.66% 4 | 1.09% 5 | 2.41% |
| 1990-2 | -1.06% 1 | 0.28% 2 | 0.30% 3 | 0.87% 4 | -0.65% 5 | -0.26% |
| 1994-2 | 0.01% 1 | 0.49% 2 | 0.06% 3 | -0.52% 4 | -0.56% 5 | -0.53% |
| 1998-2 | -0.18% 1 | 0.82% 2 | 0.10% 3 | 0.40% 4 | -0.39% 5 | 0.75% |
| 2002-2 | 1.43% 1 | -0.40% 2 | 0.99% 3 | -0.18% 4 | -1.10% 5 | 0.75% |
| Avg | 0.20% | 0.21% | 0.29% | 0.25% | -0.32% | 0.62% |
| SPX summary for Presidential Year 2 1974 - 2002 | ||||||
| Averages | -0.38% | -0.05% | 0.27% | 0.02% | -0.04% | -0.19% |
| %Winners | 38% | 50% | 88% | 38% | 25% | 38% |
| MDD 2/9/1982 2.81% -- 2/17/1978 2.35% -- 2/11/1974 1.81% | ||||||
| SPX summary for all years 1971 - 2005 | ||||||
| Averages | 0.00% | 0.03% | 0.29% | -0.08% | -0.13% | 0.11% |
| %Winners | 54% | 57% | 69% | 37% | 34% | 54% |
Interesting chart
I happened to look at these two indices one after the other and thought the chart had not changed. The index in red is the American Stock Exchange composite (ASE), the CRB (Commodity Research Bureau - I think) commodity index is in blue. The ASE is dominated by natural resource issues and the CRB is a commodity price index so it should not be surprising they correlate. Recently the correlation has been surprisingly tight.

Conclusion
Except for downside volume which is leveling off, most of the indicators are heading downward. I think there is, at least, one rally left that should be primarily a blue chip affair. Because downside volume is weakening a rally could begin next week.
I expect the major indices to be higher on Friday February 17 than they were on Friday February 10.
This report is free to anyone who wants it, so please tell your friends. They can sign up at: http://alphaim.net/signup.html. If it is not for you, reply with REMOVE in the subject line.
The indices were mixed, the blue chip indices up while the small cap indices were down so I am calling last weeks positive forecast a tie.


