


A 3-dimensional approach to technical analysis
Cycles - Structure - Price projections
"By the Law of Periodical Repetition, everything which has happened once must happen again, and again, and again -- and not capriciously, but at regular periods, and each thing in its own period, not another's, and each obeying its own law ... The same Nature which delights in periodical repetition in the sky is the Nature which orders the affairs of the earth. Let us not underrate the value of that hint." -- Mark Twain
A Bull Market Top?
A Review of the Past Two Weeks.
The correction of the intermediate-term trend which began last October did not affect all averages in the same manner, but it appears to have ended in the middle of February for all of them. Since then, The Dow Jones Industrials has made the strongest showing, rising to a new bull market high of 11,159, followed by the NYSE Composite and the Russell 2000 index, both of which just managed to eke out a new all-time high figure. The SPX almost made it to its former high, but fell just short of it before pulling back slightly. The Nasdaq was conspicuous by its relative weakness during this time period. This has implications which will be discussed later.
Market breadth remained generally positive, but both the breadth and the price momentum are in a noticeable deceleration process.
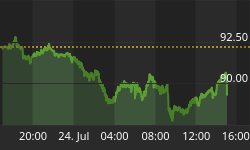
Crude oil pulled back close to its reaction lows and made a short-term double bottom at 60, but it has jumped back up in the last couple of days as a result of the geopolitical situation in the Middle-east and Nigeria. The US Dollar has continued to rally and touched 91, but it is losing short-term momentum, while gold is in the process of recovering from its recent substantial retracement form a recent multi-year high.
Current Position of the Market.
SPX: Long-Term Trend - Equity indices are in the process of ending the bull phase which began in October 2002 and are about to begin a retracement into the 4-year cycle low which is due in October 2006.
SPX: Intermediate Trend - After a mild correction, the intermediate-term trend which began in October has resumed, but the new uptrend is losing momentum and should soon reach a top from which a more substantial decline will take place.
Analysis of the short-term trend is done on a daily basis with the help of hourly charts. It is an important adjunct to the analysis of daily and weekly charts which determines the course of longer market trends. Daily market analysis of the short term trend is reserved for subscribers. If you would like to sign up for a FREE 6-week trial period of daily comments, please let me know at ajg@cybertrails.com.
What's Next?
Have we reached the top of the bull market? Generally speaking, yes! It is almost certain that the Nasdaq has seen its high for this bull cycle, but other indices could have a little more oomph left in them before reaching their apogee.
Let's start by analyzing the weekly charts of two indices: the SPX and the Nasdaq 100. The time period which is shown here encompasses the second phase of the bull market which began in July 2004 and spans to the present.

I have drawn channel lines which shows that the market was in a clear uptrend, although it was not as dynamic as the first phase which ended in January 2004. Within the larger trend, I have also drawn a shorter, secondary channel which begins in April 2005. Prices have found resistance in the vicinity of the intersection of the two top channel lines, and both indices made their high in early January and had a 4-week retracement.
The first thing to notice is that the pull-back was far more severe in the NDX than it was in the SPX. You can see that there is a tendency for the present pattern to repeat itself in the early part of each year, and each time the NDX has led the SPX in a corrective, multi-phase decline. We have recently completed the first down phase of this pattern, and we are now rallying from its low.
What the market is currently doing appears to me more 'similar' to 2005 than 2004, but we have to be careful about looking for an exact replica of previous historical periods. These have a fractal relationship,-- similar, but not exact. Both indices are presently in a very short term rally mode which has probably not come to an end just yet, but could at anytime. Afterwards, the NDX should resume its down trend and take the SPX along with it, as it has in the past. Will the pattern continue and mimic last year's with a low in May followed by a rally? That can be determined later as the decline evolves.
There are a number of cycles that have spans shorter than 4 years and which cause the shorter market fluctuations. The 36-week cycle, which is due in the middle of March is the half-span of a very regular 72-week market rhythm that I have discussed before. However, these are "change in trend" cycles, and the end of their phases can produce either highs or a lows. In October 2004, in conjunction with the 12-month cycle, the 36- week cycle produced a significant low. In June 2003, it marked the end of a rally. If it is making a high this time, could it hold off the top of the bull market for another one or two weeks? This is what we are trying to establish right now: whether or not the current short-term rally can extend itself for a while longer.
I recently did an extensive short-term analysis of the current rally using an hourly chart which includes probable final price projection for the SPX and the technical conditions that will signal a reversal. It is important to determine when this short-term reversal takes place because I believe that it will signal the beginning of the bear phase for the markets that are still in an uptrend, and this makes intra-day analysis all the more important at this juncture.
What kind of a bear phase can we expect? The 4-year cycle is one of the most observable market cycles and its span is long enough to create substantial market moves which are usually labeled as bull and bear markets. Its last low was in October 2002 and the next low should come in October 2006. The 4-year cycle however, is a subdivision of a larger cycle: the 12-year cycle which, itself is a subdivision of an even larger cycle that will come to play an important role in the not-too-distant future, but does not need to be considered at this time.
October 2002 represented not the only the low of the 4-year cycle, but of the 12-year cycle as well, and since it is still in an up-phase it remains the main driving force behind the stock market right now. This is why the 4-year bull market cycle top is coming so late, almost 3 ½ years from its low. In cyclical parlance, when a cycle makes its high beyond its half-way mark, it is said to exhibit "right translation", and that is a sign that a larger cycle is delaying is down phase. In the case of "left translation", a larger cycle exerts downward pressure causing it to peak early, and this is likely to be the case with the next 4-year cycle.
With approximately 6 months to go into the 4-year low, it's already pretty evident that we are not going to see a decline which approaches that of the last major bear market -- the one which started in 2000 and lasted for a couple of years. Besides being shorter, this bear phase should also lack the intensity of the previous one because the larger cycle will restrain the decline. After the top of the SPX has been confirmed, (which should be relatively soon) it will be possible to estimate the extent of its bear phase. For now we can take a guess and say that up to a 50% retracement of the previous rise is reasonable.
Let's now take a look at the daily version of the charts above, with a focus on the short-term action, in order to determine what will constitute a sell signal for the SPX.

The relative weakness of the Nasdaq 100 since the mid-January top is even more obvious here, and the short term up trend more noticeable. The SPX could still make it to a slightly new high, as it did last year but that's not relevant because the upside potential is very limited. If it should push up further, it will again meet heavy resistance at the top of the longer-term channel. We need to be on the lookout for both indices to reverse their short term up trends. When the trend lines are penetrated, it will undoubtedly signal the resumption of the decline for the Nasdaq 100 and the beginning of the slide for the SPX, providing the following takes place:
a) Since the breadth statistics are always an important confirmation of a trend, the advance/decline ratio should become more negative and this negativity more sustained than it has been up to this point. This should be reflected in a downward bias of the A/D line, and negative readings in the McClellan oscillator and the summation index. The new highs new lows should also turn negative.
b) The level marked by the horizontal red line on the charts below should be broken for both indices. After that, it should be a series of lower highs and lower lows all the way to the bottom of the 4-year cycle.
Leading indicators: I have spoken in the past of leading market indicators which have included GE, the XBD and the BKX. I have also demonstrated above, the value of the Nasdaq 100 as a leader of the SPX. Perhaps this is the most reliable of them all, at least for the short to intermediate term trend.
GE probably comes next, but it appears to have a longer lead time. The reason given is that it is such a diversified company, it is more sensitive to potential economic changes than even the market itself. I guess that makes sense, but whether it's valid or not, I don't know. Nevertheless, the stock has a good history of leading the market and, as I have shown in a recent newsletter, it has been saying for quite a while that a correction is overdue.
Because banks do less business in a recession, it also makes sense that the banking index should be viewed as a leading indicator. Therefore it is interesting that after a long period of consolidation, the XBD made a new high last week. No hint of a market correction directly ahead, there! Perhaps this means that the economic slowdown which is normally associated with the 4-year cycle bear phase will be very mild, and this would lend substance to the view that this not going to be a big deal bear market.
I am discarding the XBD. I don't really know why it has a reputation of being a market prognosticator, because it gave no warning whatsoever in 2000 and made a much higher peak 6 months after the stock market.
SUMMARY: The bull phase of the 4-year cycle which began in October 2002 has most likely already come to an end for the Nasdaq.
Although the major indices are all exhibiting diverse degrees of long term strength, they are in the same relative position and they should all begin to enter into a corrective phase which should last until October.


