


What I find remarkable about the United States is that Americans have the talent to always put on a huge show, which then turns into a lot of hot air. The US went with "The Best Team in the World", as the Americans proclaimed, to the Winter Olympics in Turin. However, the best team was Germany, which won with a population just 30% that of the US, 29 medals compared to 25 for the US, while Austria with a population of less than 10 million won 22 medals. A lot of hot air is also visible on Wall Street. Despite all the bullish statements by strategists and analysts, so far the Dow Jones Industrial and the S&P are up year-to-date just 3%! By comparison, Hong Kong is up year-to-date 6%, India 13%, while the best performing stock market in Asia was Vietnam, which is up 29% (see figure 1).
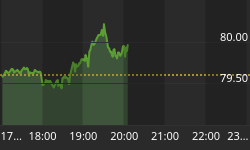
Figure 1: Vietnamese Stock Exchange Index 2005 - 2006
Source: Bloomberg
And while I am somewhat hesitant to chase the Vietnamese stock market on the way up, looking at the valuation of Vietnamese shares, which hovers around 10 times earnings and the country's promising economic prospects, it is likely that the market will continue to rise much further. Elsewhere, yearto- date, Russia was up 32%, Peru 31%, the Kingdom of Mr. Bush's Pen Pal, Hugo Chavez, 49%, Brazil 29%, while Qatar and the UAE were down 20%. Last month's commentary made the case that a correction time had begun or was imminent. This remains my view and I would like to reiterate my near term negative stance toward all asset classes, including commodities, for the intermediate term (3 - 6 months). There are several reasons for this pessimistic view. As can be seen from figure 2, mid-term election years in the US have a tendency to decline into October following an initial rally, in the first few months of the year (see figure 2)
Figure 2: Average Stock performance in Mid-Term Election Years
Source: www.chartoftheday.com
The second reason for being cautious about the US stock market is that the Bradley Model, which is based on planetary alignments, will shortly turn down. From figure 3, we can see that the Bradley model correctly called the current rally by bottoming out in December 2005. Soo, however, the model will turn down again until November 2006 (see figure 3). And while I would certainly not bet my farm on the basis of the Bradley model, its record compares rather favorably with the forecasts of Wall Street strategists and analysts.
Figure 3: The Bradley Model
Source: Arch Crawford
Another reason for caution is the well-established tendency for the stock market to do well between October and May but to perform poorly over the summer months. In the past, the best time to buy stocks was usually around October/November and to sell in the spring.
I may add that the four year stock market cycle (it lasts about four years from through to through) will also bottom out in October 2006, since the present rally began in October 2002. Based on the four year cycle a sharp decline starting soon is likely.
Then, there is the issue regarding interest rates. As I have opined before, it is likely that in the next few years yields on US treasuries will rise further than is now commonly assumed. In fact, of all asset classes, it is very probable that 30-year US-Treasury bonds are the worst possible investment should one buy them with a view to hold them to maturity (see figure 4).
Figure 4: 20 Year Treasury Bond Fund (Leh) iShare (TLT)
Source: www.decisionpoint.com
I am not talking here about buying bonds as a trade for the next ten minutes or 3 months but as an asset an investor would wish to hold for the long term. In fact, with 2-year US Treasury notes, now yielding around 4.7%, I suspect that they already offer some competition for equities, a competition, which will become more intense as yields rise to and above 5%.
I am aware that a large number of investors are betting that the Fed will soon refrain from raising short term interest rates. My view about this is that nobody really knows how far interest rates will still rise. But from a simpleton's point of view it should be evident, that for as long as asset prices rise (in particular home and stock prices), the Fed will continue to increase interest rates. Once asset prices no longer increase in value and stall, it is likely that the Fed will then be through with interest rate increases. And, when the Dow and home prices decline by 5% to 10%, the Fed will cut interest rates aggressively (not in baby steps). Now, I am aware that there is a widespread belief among investors (in fact this is presently probably the most entrenched belief within the investment community) that once the Fed starts to cut rates, stocks will rally. However the historical evidence does not support this view. On average, in the post Second World War period, the S&P 500 was, following the end of a tightening interest rate cycle, down 0.5% after three months, down 1% after six months, but up 1% after one year. So, if we assume that the Fed will stop increasing interest rates within the next 3 months or so, the stock market is unlikely to do well right away. Moreover, as I explained in earlier reports, the US dollar should also resume its bear market once investors will begin to anticipate the end of interest rate increases.
The other extremely entrenched consensus view among investors is that bonds will rally once the Fed begins to cut interest rates. Since bonds did not sell-off while the Fed raised rates between June 2004 and today, it is far from sure that they will rally once the Fed cuts interest rates and once the dollar resumes its downtrend.
Another point I should like to make about the US stock market is that the rally since October 2004 has from a technical point of view been far from convincing. In recent weeks a large number of stocks have failed to better their November 2005 highs, and the Ten-Day Moving Average of new Highs has been declining (see figure 5). At the same time, the Lowry Selling Pressure Index has been rising while the Buying Power Index has been declining.
Figure 5: New 52-Week Highs, NYSE (10-Day Average)
Source: Arch Crawford
Finally, our regular readers will recall our negative stance towards the US housing market in 2005. Since homebuilders have been a leader of the post 2002 bull market, it is noteworthy that this sector shows signs of weakening (see figure 6). Since homebuilders have been out-performing the US stock market since 2000 (when the TMT sector began to collapse), it is probable that homebuilders are now also leading the broad market (and the economy) lower. As can be seen from figure 6, the housing index peaked out in July 2005 and is now down by 12% from its high (individual homebuilders have declined by far more - Toll is down by 50% from its 2005 high).
Additionally, it is not a good sign for the US stock market that other leaders such as Google and Apple seem to have topped out while heavy weights like GE, Wal-Mart, Citigroup and General Motors (the latter not a market cap heavyweight but still an economically important company - at least symbolically) are languishing or declining in price.
Figure 6: Philadelphia Housing Index (HGX), 2003 - 2006
Source: www.Decisionpoint.com
I have maintained in the past that emerging stock markets would outperform the US stock market. However, since most emerging stock markets are, today, very far along in their up-trends and are in some cases very overbought, I would expect the coming US stock market weakness to lead also to substantial corrections in emerging markets. This does not mean that the long-term bullish case for emerging stock markets is abandoned, but within long term bull markets severe corrections are more the norm than the exception. In this respect, I should also like to point out that in the case of commodities, for which bull and bear market phases tend to last between 20 and 30 years (the ideal cycle lasts from peak to peak between 45 and 60 years), severe corrections and "commodity rotation" - with one group of commodities taking the leadership from another - are also common. From figure 6, we can see that between December 30, 1974 and August 1976, the gold price dropped from $ 195 to $ 104, before soaring another 8 times to its January 1980 high.
Figure 7: Gold Price 1970 - 1976
Source: Ron Griess, www.Thechartstore.com
In sum, my view is that holding cash is now not such a bad alternative. I fully expect to be able to buy most assets at lower prices within the next three to six months.


