


The good news is:
• Many of the major indices including the S&P 500 (SPX), Dow Jones Industrials(DJIA), Russell 2000 (R2K) and Wilshire 5000 (Wil-5) closed at multiyear or alltime highs Friday.
Notably missing from the above list are the S&P mid cap index (only 0.1% off its all time high) and NASDAQ composite (OTC) (1.1% off its early January multi year high).
Short term
The extreme volatility of the past two weeks has distorted the short term indicators. Several of the major indices including the Wil-5, SPX, OTC and R2K have had 4 or more consecutive down days quickly followed by as many as 6 consecutive up days. This kind of volatility has occurred most often near turning points. For example, the last time the Wil-5 had a similar pattern was at the 2004 low in August. The two occurrences before that were around the high of March - April 2003 and near the lows of July and October 2002.
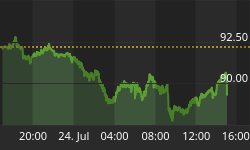
The first chart covers the period from the low nearly a year ago with dashed vertical lines on the 1 st trading day of each month.
The indicator, in blue shows the percentage of the last 4 trading days that have been up, the index in red is the Wil-5. The indicator reaches the top of the screen when there have been 4 or more consecutive up days and it reaches the bottom of the screen when there have been 4 or more consecutive down days.
Before last week, there had not been 4 consecutive down days since the October low.

Intermediate term
The secondaries lead both up and down.
The chart below covers the period from the April low through last Friday. It shows the OTC in red and Accutrack (AT) a FastTrack relative strength indicator in black. AT is comparing the strength of the R2K to the SPX. When the R2K is stronger than the SPX the indicator moves upward. The indicators current pattern is similar to the high of last August.

Seasonality
Options and futures expired last Friday.
The week following the 3rd. Friday in March has been mixed averaging a little up for the OTC during the 2nd year of the Presidential Cycle and a little down over all years. The index has been up about half the time by either measure. What is interesting in the tables below are the extremes, the index has been up or down nearly 2% about half of the time. The same is true for the SPX, but the bias has been a little more negative.
Report for the week after options expiration during Mar
The number following the year is the position in the presidential cycle.
Daily returns from Monday to Friday.
| OTC Presidential Year 2 | ||||||
| Year | Mon | Tue | Wed | Thur | Fri | Totals |
| 1966-2 | 0.56% | 0.56% | 0.60% | -0.03% | 0.53% | 2.22% |
| Avg | 0.56% | 0.56% | 0.60% | -0.03% | 0.53% | 2.22% |
| 1970-2 | 0.15% | 0.24% | 0.46% | 1.66% | 0.00% | 2.51% |
| 1974-2 | -1.20% | -0.65% | 0.21% | 0.43% | 0.09% | -1.11% |
| 1978-2 | -0.09% | -0.32% | 0.13% | 0.22% | 0.00% | -0.06% |
| 1982-2 | 1.21% | 0.64% | -0.06% | 0.57% | -0.36% | 1.99% |
| 1986-2 | 0.38% | -0.38% | 0.36% | 0.73% | 0.00% | 1.09% |
| Avg | 0.09% | -0.09% | 0.22% | 0.72% | -0.13% | 0.89% |
| 1990-2 | 0.17% | -0.64% | -0.18% | -1.09% | 0.63% | -1.11% |
| 1994-2 | -0.82% | -0.12% | 0.15% | -1.36% | -0.41% | -2.57% |
| 1998-2 | 0.18% | 1.12% | 0.63% | 0.25% | -0.27% | 1.91% |
| 2002-2 | 0.47% | 0.20% | -2.55% | 1.96% | -0.93% | -0.85% |
| OTC summary for Presidential Year 2 1966 - 2002 | ||||||
| Avg | 0.10% | 0.07% | -0.02% | 0.33% | -0.10% | 0.40% |
| Win% | 70% | 50% | 70% | 70% | 43% | 50% |
| OTC summary for all years 1963 - 2005 | ||||||
| Avg | -0.27% | -0.18% | 0.12% | 0.17% | 0.05% | -0.12% |
| Win% | 49% | 40% | 49% | 65% | 47% | 53% |
| SPX Presidential Year 2 | ||||||
| Year | Mon | Tue | Wed | Thur | Fri | Totals |
| 1930-2 | 1.00% | -0.12% | 1.53% | -0.20% | 0.00% | 2.20% |
| 1934-2 | -2.25% | 2.01% | -1.97% | 1.82% | 0.00% | -0.39% |
| 1938-2 | -0.29% | -3.08% | -1.99% | 0.30% | 0.00% | -5.05% |
| 1942-2 | 0.37% | 0.86% | -0.73% | -0.37% | 0.00% | 0.13% |
| 1946-2 | 0.80% | -0.68% | 0.74% | 0.68% | 0.00% | 1.55% |
| 1950-2 | -0.29% | 0.06% | 0.57% | 0.06% | 0.00% | 0.40% |
| 1954-2 | -0.07% | -0.71% | -0.49% | -0.19% | 0.53% | -0.93% |
| 1958-2 | 0.38% | -0.33% | -0.33% | -0.31% | 0.07% | -0.52% |
| 1962-2 | -0.13% | -0.27% | -0.21% | -0.16% | 0.07% | -0.69% |
| Avg | 0.14% | -0.39% | 0.06% | 0.02% | 0.22% | -0.04% |
| 1966-2 | 0.76% | 0.29% | -0.37% | 0.18% | 0.28% | 1.14% |
| 1970-2 | -0.32% | 1.14% | 2.03% | 0.17% | 0.00% | 3.02% |
| 1974-2 | -1.24% | -0.84% | 0.35% | -0.24% | -0.07% | -2.03% |
| 1978-2 | -0.55% | -1.13% | -0.36% | -0.12% | 0.00% | -2.16% |
| 1982-2 | 1.95% | 0.69% | -0.51% | 0.21% | -1.12% | 1.22% |
| Avg | 0.12% | 0.03% | 0.23% | 0.04% | -0.30% | 0.24% |
| 1986-2 | -0.03% | -0.26% | 1.10% | 0.70% | 0.00% | 1.51% |
| 1990-2 | 0.47% | -0.57% | -0.54% | -1.19% | 0.46% | -1.37% |
| 1994-2 | -0.53% | 0.06% | -0.06% | -0.89% | -0.81% | -2.24% |
| 1998-2 | -0.34% | 0.92% | -0.33% | -0.10% | -0.49% | -0.34% |
| 2002-2 | -0.05% | 0.41% | -1.58% | 0.15% | -0.42% | -1.49% |
| Avg | -0.10% | 0.11% | -0.28% | -0.27% | -0.32% | -0.79% |
| SPX summary for Presidential Year 2 1930 - 2002 | ||||||
| Avg | -0.02% | -0.08% | -0.16% | 0.03% | -0.15% | -0.32% |
| Win% | 37% | 47% | 32% | 47% | 50% | 42% |
| SPX summary for all years 1928 - 2005 | ||||||
| Avg | -0.34% | 0.00% | -0.15% | -0.27% | -0.10% | -0.81% |
| Win% | 35% | 45% | 40% | 30% | 36% | 35% |
Conclusion
The extreme volatility of the past two weeks inhibits the usefulness of the indicators. On the other hand, extreme volatility is usually seen around major turning points and we are in the midst of the period the high for the 2 nd year of the Presidential Cycle is usually observed.
I expect the major indices to be lower on Friday March 24 than they were on Friday March 17.
This report is free to anyone who wants it, so please tell your friends. They can sign up at: http://alphaim.net/signup.html. If it is not for you, reply with REMOVE in the subject line.


