


A 3-dimensional approach to technical analysis
Cycles - Structure - Price projections
"By the Law of Periodical Repetition, everything which has happened once must happen again, and again, and again -- and not capriciously, but at regular periods, and each thing in its own period, not another's, and each obeying its own law ... The same Nature which delights in periodical repetition in the sky is the Nature which orders the affairs of the earth. Let us not underrate the value of that hint." -- Mark Twain
A Bull Market Top?
A Review of the Past Two Weeks.
The Dow Industrials was the clear winner for the last fortnight, rising sharply the week before last, but trading essentially unchanged along with most of the other major indices this past week.
Second best was the NYSE composite which, along with the Russell 2000, recorded another historic high.
The Nasdaq continues to be the laggard with the Nasdaq 100 being the weakest.
Oil remains at the lower range of a 7-month consolidation pattern.
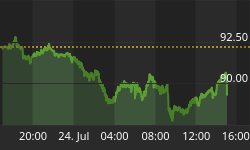
Gold is also consolidating its recent strong advance, and the Dollar has made little progress in two months, still trading at 90.
Current Position of the Market.
SPX: Long-Term Trend - Equity indices are in the process of ending the bull phase which began in October 2002 and are about to begin a retracement into the 4-year cycle low which is due in October 2006. There no clear sign that a top has been reached just yet except, perhaps, for the Nasdaq 100.
SPX: Intermediate Trend - The intermediate-term trend which began in October just made a new bull market high but will be coming to a critical point, next week.
Analysis of the short-term trend is done on a daily basis with the help of hourly charts. It is an important adjunct to the analysis of daily and weekly charts which determines the course of longer market trends.
Daily market analysis of the short term trend is reserved for subscribers. If you would like to sign up for a FREE 6-week trial period of daily comments, please let me know at ajg@cybertrails.com.
What's Next?
In order to clarify where we are in the 4-year cycle bull market phase, we need to visualize clearly what has taken place since the 2002 bear market low. We'll do this with a weekly chart of the SPX.
The channels indicate the main phases which are numbered I, II, III. This is not EW labeling.
At the bottom, I have identified the main cycles which are driving this bull market. I have also numbered the years of the decade in order to keep track of the decennial pattern, a graph of which is provided after this chart.
It is clear that the combined 12-year and 10-year cycles are the forces behind the market strength. This is offsetting the downward pressure of the 4-year cycle which is now almost three and a half years into its phase. It is also clear that the decennial pattern (not to be confused with the 10-year cycle) is progressing on schedule. It is generally expected to continue to do so but, this decade, it may turn out to look more like the combined graphs of the 50's and 60's.


Next, we'll concentrate on phase III and see how it has affected the other major indices.
So far, there is no visible weakness and the indices remain in a long-term uptrend. Both the Russell 2000 and the NYSE Composite are at the very tops of their channels, while the Dow has been playing catch-up lately, and the Nasdaq is having problems keeping up with the others. The Dow has just reached an internal resistance line which stopped the Nasdaq 11 weeks ago, and this could keep it from making further progress as it did with the Nasdaq.

The overall impression conveyed here, is that the 4-year cycle high has probably already been reached by the Nasdaq, but the other indices may just now be reaching their apex:
-
The NYA and the RUTX are at the tops of their channels, and this is normally a point of strong of resistance, although it is difficult to determine on this chart exactly where the top trend line runs, and if a climactic move takes place, the top of the channel could be briefly penetrated.
-
The Dow has just concluded a 5-wave pattern which started 9 weeks ago, bringing it up against the internal trend line mentioned above. 5-wave patterns are normally followed by a reversal.
-
The short-term cyclical pattern favors a top in this time frame with a retracement into the month of April.
-
There is a growing dichotomy between the S&P 500 and the Nasdaq 100 which is demonstrated on the next chart.
Both indices had similar price action until early January. After they had undergone a 5-week consolidation, the SPX then progressed to new highs but the NDX did not. Furthermore, the former is trading in the upper half of its channel range, but the NDX has already challenged its uptrend line and former low. If a market decline begins shortly, it will be very easy for the NDX to confirm an intermediate down trend by breaking its trend line and making a new low.
The underperformance of the NDX relative to the SPX has an excellent record of signaling that a market decline is about to take place.

With this as a background, let's see if we can determine what would constitute a reversal indicative of an intermediate top. The SPX is a good average of all the other indices, and its behavior is probably more representative of the stock market as a whole. Its long term chart is more similar to those of the Dow and Nasdaq in that it seems to be stalling before reaching the top of its channel, and this could be considered the beginning of long term deceleration, although not as severe as the Nasdaq's. Within that trend, we only need to consider the current phase which began last October because its completion is likely to mark the market's 4-yr cycle high.
First notice that a rounding top is forming on the daily chart of the SPX. The price is now moving in a lateral channel and has been confined to a narrow band at the top of that channel for the past 8 trading sessions. As you can see, there is good support in the area inside the upper red circle. That level is about 1297, and marks the convergence of trend lines and support from former tops. If that level is penetrated, the first support level is just above 1280 and the next one down (in the area inside the lower red circle) is just under 1270. This also represents the mid-point of the long-term channel, so if it does not hold, we could be pretty well assured that an intermediate term decline has begun.
The oscillator below is that of the A/D. After becoming oversold, it attempted to get back into an uptrend but, like the price, it seems to have fizzled and is now stuck in neutral. This is not a constructive pattern, and it indicates that both the long term and the short term momentum since the October low have been lost.

In conclusion, there are many indications that the market is ready to reverse and this is supported not only by a short-term cycle topping in this area, but by longer cycles bottoming in April. However, trend lines and levels must be penetrated for confirmation.
Also, because the long term trend has been so strong, I would not be surprised if more topping action were required before a significant decline could get under way.
SUMMARY: The long term trend is still intact, but it may be close to reaching a terminal point which would represent the top of the 4-year cycle bull market. Because of the near-term cyclical configuration and the position of the major averages within their long-term channels, this could take place as early as next week.


