


A shortened week with a 4 day holiday has resulted in a dull market during the week. It's Easter so I'll keep this week's commentary short.
GOLD
LONG TERM
As mentioned, I'll keep this week's commentary short, only the facts. Besides, It's my birthday and my daughter has flown in from Vancouver for the occasion (so she says, I think she was just escaping from the continuous rain).

Since the long term P&F chart broke on the up side at $300 in very early 2002 it has been up, up and away ever since. Only a couple of times has it given us any minor worry, but never breaking the BULL by crossing below the up trend line PLUS moving below two previous Os. It did the reverse to start the BULL. We also have that up trend resistance line (the solid red line) that has basically trapped the action throughout the rise. Rallies have resulted in the resistance line being broken on three occasions, but not for long. It looks like gold may once more reach the resistance line so traders should expect a reaction shortly. Once the price hit $600 it has satisfied all of our long term projections (based upon this chart) except for the latest projection from the most recent pattern break. That projection is to the $680 level. Of course, still in play are my two very long term projections, to $1075 and then to $1575.
Although the long term price momentum has shown signs of the price trend weakening there is really nothing in the long term indicators to yet start any kind of worry. We might be in for a correction soon but not to worry yet from the long term standpoint.
Still BULLISH on the long term position.
INTERMEDIATE TERM

Since breaking out of its recent consolidation pattern with a $705 projection the intermediate term P&F has been acting quite well. Nothing yet in the chart that would suggest a reversal of trend ahead although that does not mean that a reversal could not happen. So for now we can sit back and relax a little, P&F wise.
In early March we had the price of gold drop below its intermediate term moving average line but the line remained in a positive direction and a couple of weeks later gold was once more above the line. An old technical concept is to buy on such price reversals (as long as the moving average line does not turn down). So far, so good. Price momentum, although still positive, continues to show weakness versus the price moves while the volume indicator is in a lateral trend under performing the price action. The weekly MACD is showing such under performance.
Despite some individual indicator weakness the present position of gold is still classified as BULLISH, intermediate term wise.
SHORT TERM
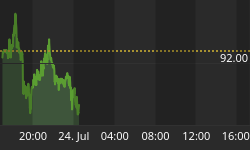
The chart on the next page clearly shows the present 3 week short term up trend but also what appears to be a topping reversal in progress. I know I've said that before but if I keep saying it often enough it will come true and THAT is the one we will all remember, wouldn't we?
The short term moving average line is still strongly positive. It is interesting how closely the moving average line is linked to the up trend line. Momentum has been in a basic lateral trend with a downward bias. It is getting ready to break below its support line. That might be the signal that a reaction has set in but one would need to be following the indicator on a daily basis to catch the turn. Go with the existing trend so it's still BULLISH but will change should gold close below $495.

IMMEDIATE TERM
As for the immediate trend, well that should be classified as NEUTRAL. The price seems to be reversing and topping but not yet reversed. The Stochastic Oscillator is still in the overbought zone where it has been for over two weeks BUT it looks like it is getting weaker and ready to move below the overbought line for a trend reversal. It is below its trigger line and at its lowest point since entering the overbought zone. So, I'm calling the immediate term trend as NEUTRAL but with a very strong negative bias. Should the SO drop below the overbought line then a bearish trend can be called.
NORTH AMERICAN GOLD INDICES
Not a week to brag about. Most major Indices went basically nowhere, give or take a point. The previously under performing S&P/TSX Capped Gold Index has not done too badly since bottoming out last May. It declined a little during the week but is still up over 80% in the past 11 months. Other Indices have done better but for a major Exchange Index it's not too bad. Holders of the ETF based upon this Index are probably not complaining. We might see some weakness from here but I don't expect anything major to occur over the next week to cause a panic, unless Iran and North Korea should announce they are real good buddies.
MERV'S PRECIOUS METALS INDICES
Except for the highly speculative Indices, the Merv's Indices were also in a snooze mode during the week. Only the Gamb-Gold and Spec-Silver had performances of any magnitude and they were on the down side.
MERV'S GOLD & SILVER 160 INDEX
The universe of 160 stocks declined an average of 1.3% during the week. As we can see from the other Indices the decline was propelled by the more speculative, or gambling, stocks in the universe. On the chart the decline is still nothing to be concerned about. There were 50% more declining stocks than advancing stocks during the week (92 versus 60) while all the BULLISH overall ratings declined somewhat.
There was only one stock in my plus/minus over 30% weekly move category. That stock was MAG Silver with a loss of 33.0%. MAG Silver was initially included in the universe of 160 on 23 Dec 2005 and was already POS. Despite the drop MAG Silver still showed a gain of 94% in these 3 to 4 months. The Technical tables would have shown MAG going POS in 09 Sept 2005 at $0.92 and would have shown a gain of 178% after last week's drop.

The best performer in the universe of 160 during the week was Tyhee Development with a gain of 27.1%. Tyhee was originally recommended in mid January @ $0.20 and is now ahead 55% since recommendation. As the chart suggests, Tyhee may be only at the early start of a move with lots more upside to come. My P&F chart suggests a projection to the Dollar level. Let's see how this stock performs into the future.
MERV'S QUAL-GOLD INDEX
The Qual-Gold Index gained 0.3% on the week. You can hardly see the gain but it's there and better than a loss. With 20 gainers and 10 losers the ratio was comfortably on the winners side. The BULL ratings of last week moved higher by a few points.
MERV'S SPEC-GOLD INDEX
The Spec-Gold Index had the best performance of the Merv's Indices but even here it was only a 0.5% gain. It was that kind of week. Although the gainers and loser both were at 14, the gainers had just a little more percentage on their side. The BULL ratings barely moved with the dull weekly action.
MERV'S GAMB-GOLD INDEX
Them that rises the most also falls the most. The Gamb-Gold Index fell 2.5% for the worst performance after the Spec-Silver loss. This is to be expected from an Index that has risen as this one has. The MAG Silver loss was in this Index but so was the Tyhee gain. Many stocks had double digit gains and losses in the Index. But the overall performance was 9 winners and 18 losers. As might be expected, the BULL ratings dropped just a notch.
MERV'S QUAL-SILVER INDEX
With 6 winners and 4 losers the Qual-Silver Index gained 0.2% on the week. Next to no movement could be seen in the BULL ratings.
MERV'S SPEC-SILVER INDEX
Despite a gain in the price of silver (up 6.5% on the week) the Spec-Silver Index had its second worst week in years. With a loss of 5.3% it was the poorest performing Index in the Merv's Gold Indices table. With 17 losers and only 5 gainers the loss was not due to one or two stocks but general in nature. But this was to be expected after its superb performance over the past year. Despite the drop nothing serious is showing up in the charts yet.
Well, I'll leave it at that and get back to a more normal commentary next week.


