


Yesterday, we said that the Fear Index was at a "pivot point". Such points can be major transitional times where the bulls and bears have a huge battle.
To some, who didn't watch the ticker yesterday, it was a normal day ... the market opened down, and then closed up. That is not the case.
Yesterday morning, the market opened straight down. Then, at exactly 9:58 AM, massive amounts of Liquidity was pumped into the markets.
**** The same morning that Bernanke was being questioned by our politicians, and that he was to announce that he might give the interest rate hikes a breather and see what happens. Before the open, China reduced their interest rates, the market dropped ... we shot a massive amount of liquidity in, and the market went up. This is a different Fed. Chairman from the past one. He listens to the opinions of other experts, and he even watches stock market screens during the day ... even gold charts.
An interesting comment he made was, "I like to let the market system work as much as possible". ??? As much possible before WHAT? Before intervening with M3 Liquidity that he doesn't have to show to the public in reports anymore?
??? Does, "I like to let the market system work as much as possible" mean that he admits that the Fed. interferes with market? We need the market system to work out its plus and minus balances on its own. The Fed. can interfere like in 1987 ... in a crisis. Enough of the Fed comments ... let's go to our update.
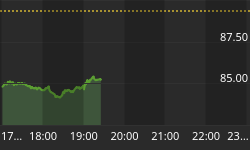
*** Yesterday was NOT a normal trading day. Below are 1 minute charts of the NYA, the DOW, and our Institutional Index. Before I discuss it, let me what happened Wednesday morning BEFORE the open. Five minutes before the open, I called Peter P. a Hedge Fund Manager and said, "Peter, the market hasn't opened and they just pumped three quarters of a billion dollars into the market ... its going to open gap up". It did, but in spite of all that money, the market really didn't show the strength it should have.
Below ... I drew a vertical line below that depicts the open of yesterday's market to the right. To the left, is what a NORMAL looks like on a minute chart. Yesterday, was not just a normal trading day, it was a day of market interference, liquidity injections, and program trading.

The past two days have seen unusual liquidity injections. This interferes with normal market balances, but ... over enough time, market balances will win out and re-establish what the real scenario should be.
Below, is a multi-day chart of the 3 indexes above ... plotted against the VIX (Volatility Index). *** I inverted the VIX so that it would track with the indexes.
I will share just 1 observance.
1. Note the dark red line on the VIX and its slope. It slopes down. (If it wasn't inverted, it would tell you that higher bottoms were being made.) Note labels 0, 1, 2, and 3.
--- As the VIX made a lower top between labels 0 and 1, the Indexes made a higher/high from 0 to 1 ... and then the divergence resulted in a drop on the indexes.
--- What is interesting about the resulting drop, is that the NYA and the DOW dropped and made a higher/low ... BUT, the Institutional Index didn't ... it made a lower/low as see on the chart. (See the dotted lines I drew.) Short term and longer term, Institutions have not been embracing any market up moves.
--- At the end of the day yesterday, we had a similar pattern as the 0 to 1 pattern. We had a 2 to 3 pattern that is looking the same: A lower VIX at label 3 with higher/highs on the indexes from label 2 to 3.
--- What happens now? Does the divergence give us another drop, or does the kind of liquidity injections we saw in the last few days continue and it doesn't take a natural drop? I don't have the answer to this question without knowing ahead of time, what the liquidity inflows will be. These are not normal trending market conditions ... these are times of liquidity injections, with the dollar dropping, strong economic growth, government over spending, and an uncontrolled deficit.

Please Note: We do not issue Buy or Sell timing recommendations on these Free daily update pages. I hope you understand, that in fairness, our Buy/Sell recommendations and advanced market Models are only available to our paid subscribers on a password required basis. Membership information.
Do you have a friend or fellow investor that you think would appreciate receiving a link to the above Charts and Analysis today? If so, simply click on the following link to easily and quickly forward an email link. Send this Page To a Friend Link


