


The following in an excerpt from a www.institutionaladvisors.com May 11 report to subscribers.
Signs Of The Times:
"At 44% the percentage of "distressed" junk bonds is the lowestsince 1998." Standard & Poor's, May 1
"Investor Fanaticism Drives Copper Through Roof." BaseMetals.com,May 5
We talked about the latter with the ancient miner and, until recently, themain players in base metals were producers, users, and some speculative funds.
The latter were usually scorned by those in the real trade. That pensionfunds are now positioning metals is extraordinary.
Overview: Our historical work on silver and gold peaks has been timely.
Once the gold/silver ratio changed to rising on April 19, an important high would be expected some 3 weeks later. This works out to this week and the patternis worth reviewing.
First, the action in gold and silver is within the pattern that concludedirresistible important highs - including those in 1980 and 1974.
During any boom, the gold/silver ratio declines as silver outperforms gold and this has been celebrated. However, the key to the ending action is whenthe ratio reverses as, in the final weeks of the play, gold outperforms silver.
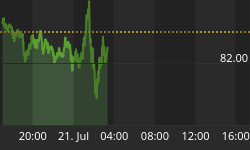
The ratio reversed on April 19 at 43.6 (82 in 2003) and tested the low at47 on May 2. While brief, we take this as a trend reversal.
This is typical of the pattern, which has been suggesting that the play would max out this week. Usually this has highs for both gold and silver, but the latter's attempt seems impaired by the excesses going into the launch of theETF.
The important thing is that gold should be enjoying a powerful move goinginto this week (√).
Perfection in pattern would include a new high for silver (14.74 on April19; 15.21 this morning).
Not all of our readers are trading gold and silver, but it is possible thatthis change will influence most market sectors.
For centuries, a declining gold/silver ratio has anticipated or confirmed a boom. For example, with the post-oil bubble contraction of the 1980s, the ratio rose to above 100 in late 1990 when Greenspan bailed out Citigroup andChase Manhattan.
Their problem? Overlending on the 1980s manias in tangible assets.
The ratio, in declining to 43.6 in April, is a huge move and accompaniedby an infatuation with both tangible and financial assets.
It is a caution.
Stock Market: The Dow and S&P are scoring new highs against the continuing negative divergence of the underperforming Nasdaq and technical deterioration.
This has been the case for a while and it's worth noting that a top is afinancial process that is only seen to be an event in retrospect.
Obviously, this is a grinding phase whereby bullish sentiment is gradually denied by deteriorating momentum. This makes the stock market vulnerable tochanges in credit availability as well as external influences.
On the latter, we have been watching the crash in the Dubai stock index. This is a proxy for the action in lesser exchanges and often at great speculativepeaks the party fails in the lesser bourses first.
It's not just the bourse that is attracting attention. Indoor skiing is now open (check out www.skidubai.com) and the slope is not as steep as the Dubai chart. Oh, we do like gravity sports and, of course, for the open mind this would include bear markets.
To be serious, leadership in the stock market is diminishing and vulnerable to the fallout from the loss of liquidity in lesser exchanges. In a domestic sense, it is vulnerable to the signal from the yield curve whereby the reversalto steepening is anticipating the next contraction.
This will become more significant when short rates begin to decline. In the meantime, and discussed above, the gold/silver ratio has reversed in a mannerthat typically anticipates a credit contraction.
Expectations are high at the most important seasonal high in the year.
Continue to lighten up.
Sector Comment: The gold sector is overdone on the upside and could correct into June. Investors can defer buying and the advice to traders has been to sell senior golds in order to buy the exploration sector on weakness.
Bank stocks have finally caught up to the fast rally in our Bank Trading Guide. This reached 229 in the latter part of April, from which it correctedto 196. Now at 203, taking out 196 would provide the "sell" signal.
Considering the volatility on the developing trend change, this will be thebiggest such signal since 1998.
Continue to lighten up on the banks and financials and get more aggressive when the "sell" is registered.
INTEREST RATES
The Long Bond is attempting to base and yesterday's Fed announcement on administered rates dropped it down to the 106 level.
This is within the seasonal weakness likely to run until this week.
Traders could buy for a brief rally.
The Dollar Index remains oversold and doggy. What is now needed forthe "buy" is the first week with an uptick in the chart.
Long treasuries have been declining with the party in metals. However, goldand silver are very close to correcting, which would steady the dollar.
Credit Spreads continue their trip through complacency land.
The high-yield, which had widened out to 455 bps, over treasuries, in lateMarch has partied in to 285 bps yesterday.
Even the medium-grade, which doesn't act like a stock, has narrowed from149 bps to 136 bps.
The Canadian Dollar continues to enjoy the good vibes from base metals andU.S. corporate bond spreads as well as a political renaissance in federal government.
However, the best is likely in on metals and spreads so the C$ could consolidatethe gains.
COMMENTS FOR METAL AND ENERGY PRODUCERS
Energy Prices: Crude oil has become choppy after setting what could be a seasonal high. The high was 75.79 on April 21, from which the initial low was 69 on Monday.
This leg up is participating with the mania in metals, but technically theaction is likely a test of the high.
Oil patch stocks have been in the same pattern and are attempting to testthe highs.
However, a tradable decline for both is likely down to a seasonal low inlate June - early July.
At that point, we will be looking for a choppy rally up until early October.
Base Metal Prices continue to ramp up in a truly spectacular fashion.
As we have been saying, this is on a steep spike and, as the saying goes, "Thesumo match isn't over until the fat guy flings."
In November, legendary copper trader, Herb Black, stated that the metal could run to $5,000/ton. It was then at $4,300 and it rose through the number inlate March and hasn't looked any other way but up.
The progress of hitting round numbers has been interesting. Starting at 4000 on November 1, it took 16 weeks to take out 5000 (on March 3). Reaching 6000 on April 12 took 6 weeks; to 7000 on April 25 was 7 trading days. A jump to8000 yesterday took a leisurely 9 days. Today it's up 5.8% at 8619.
We have not been attempting price targets but looking for signs of dynamicexhaustion.
Copper's price advance became exponential and with zinc making even more impetuous gains the action is replicating the Dot Com mania, in which caseDot Copper comes to mind as well as Dot Silver and (shudder) Dot Zinc.
Quite likely, the key to the end will be the trend reversal in the gold/silver ratio. Once past this test, the trend will have reversed and the end of themania in base metal prices should soon follow.
Continue to lighten up in the base metal mining stocks.
Golds: Once again we are facing the question - Are we there yet?
In April, the ChartWorks had a target of 172 on the XAU (which is used becauseof its longer history). Today's high has been 171.71 - close enough.
On timing, once the gold/silver ratio reversed to rising, the high for bothbecame probable some 3 weeks later - or this week.
Admittedly, it is ominous because both price and time targets are accompaniedby a raging mania - which is essential for a top.
Traders can become more aggressive in selling senior golds in order to accumulatesmaller-cap exploration stocks on weakness.
Gold/Silver Ratio: Since March, we have emphasized that the action in silver could become sensational and used the highs of 1980 and 1974 as the key examples.
In both cases, silver outperformed gold until 3 weeks before the play climaxed.
This is being accomplished now, in which case our emphasis shifts to thelikelihood that silver could underperform gold for some years.
For this, the ratio has recorded a cyclical decline from 82 in June, 2003to 43.8 in April. This has been associated with the boom.
This is typical of boom times and the reversal in the ratio will be accomplishedas it goes through 51, which will do two things.
One - that there will be a business and credit contraction. Two - thatsilver will underperform gold for a few years. It's a cyclical thing.
| FRI | MON | TUES | WED | THURS NOON | |
| May | 5 | 8 | 9 | 10 | 11 |
| High-Yield Spread | 289 | 289 | 286 | 285 | - |
| Treasury Curve | 17 | 16 | 17 | 13 | 17 |
| Base Metal Prices | 697 | 680 | 701 | 730 | 779 |
| Dollar Index | 85.1 | 85.4 | 84.8 | 84.5 | 84.3 |
| Gold | 682.2 | 677.8 | 694.4 | 703.7 | 722 |
| Gold/Commodities | 237 | 241 | 241 | 237 | - |
"Stronger than thunder's winged force
All-powerful gold can speed its course;
Through watchful guards its passage make,
And loves through solid walls to break."
Horace


