• 764 days Will The ECB Continue To Hike Rates?
  • 765 days Forbes: Aramco Remains Largest Company In The Middle East
  • 766 days Caltech Scientists Succesfully Beam Back Solar Power From Space
  • 1,166 days Could Crypto Overtake Traditional Investment?
  • 1,171 days Americans Still Quitting Jobs At Record Pace
  • 1,173 days FinTech Startups Tapping VC Money for ‘Immigrant Banking’
  • 1,176 days Is The Dollar Too Strong?
  • 1,176 days Big Tech Disappoints Investors on Earnings Calls
  • 1,177 days Fear And Celebration On Twitter as Musk Takes The Reins
  • 1,179 days China Is Quietly Trying To Distance Itself From Russia
  • 1,179 days Tech and Internet Giants’ Earnings In Focus After Netflix’s Stinker
  • 1,183 days Crypto Investors Won Big In 2021
  • 1,183 days The ‘Metaverse’ Economy Could be Worth $13 Trillion By 2030
  • 1,184 days Food Prices Are Skyrocketing As Putin’s War Persists
  • 1,186 days Pentagon Resignations Illustrate Our ‘Commercial’ Defense Dilemma
  • 1,187 days US Banks Shrug off Nearly $15 Billion In Russian Write-Offs
  • 1,190 days Cannabis Stocks in Holding Pattern Despite Positive Momentum
  • 1,191 days Is Musk A Bastion Of Free Speech Or Will His Absolutist Stance Backfire?
  • 1,191 days Two ETFs That Could Hedge Against Extreme Market Volatility
  • 1,193 days Are NFTs About To Take Over Gaming?
Is The Bull Market On Its Last Legs?

Is The Bull Market On Its Last Legs?

This aging bull market may…

What's Behind The Global EV Sales Slowdown?

What's Behind The Global EV Sales Slowdown?

An economic slowdown in many…

  1. Home
  2. Markets
  3. Other

Gold Sell, Bond Buy

Dow Jones Industrial Average   11,206
Value Line Arithmetic Index   2,025
30-Year Treasury Yield (TYX)   5.27%
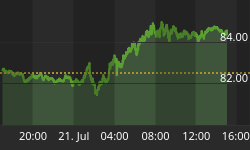
20+ Year Treasury Bond Price (TLT)   83.08
Gold 1/10 Ounce (GLD)   $68.15

The Big Picture for Stocks
The 4-year cycle calls for a bear market bottom in 2006.

Technical Trendicator (1-4 month trend):
Stock Prices   Down
Bond Prices   Up (See below)
Gold Price   Down (See below)

Markets
Our model is giving us a buy signal for bonds and a sell signal for gold. Note the chart below on bonds. We are oversold and turning upward. This may just be a temporary contra-trend move in a bear market as people flee stocks for a safer haven. But bonds are oversold and trying to turn upward. If you turned the chart on bonds upside down, you have the chart on gold. Gold is overbought and turning lower.

That is the strategy. Now here are the tactics. Place a market buy on TLT and a sell-stop on GLD at 67.90. As executed, we will place stops to reverse the positions as follows: Sell-stop on TLT at 82.49 and a buy-stop on GLD at 71.18.


Back to homepage

Leave a comment

Leave a comment