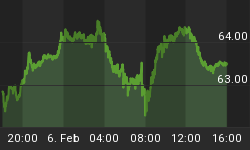
At the top all the world stock indexes were at price levels that were critically important and last week all the world stock indexes were simultaneously at support.
LET'S LOOK AT THE FTSE WEEKLY CHART FIRST

Last week I indicated the support at 5450 to 5524 was much stronger than the current level and the index will likely go there and bounce. Since we know that the 1/3rd to 3/8th retracement level is the key to holding a trend intact and that markets will bounce from that level the first time against it even if the trend were down. A move to that level was a high probability as was the bounce. The question now is will this bounce be a resumption of the uptrend or will this rally be a counter trend and fail?
LET'S LOOK AT THE DAILY CHART AND THE LAST RANGE OF MOVEMENT UP

Most technicians will now look at the move down and measure the retracement back up just as we looked at the range up and the retracement down to the 3/8 level. I would suggest that you not only look at the retracement but also look at the last range the current price is trading within.
You can see how the lows was between 5/8 and 2/3 but this is not the significant measurement as 3/8 of the major range. The move back up has moved above the 1/3 to 3/8-price retracement level and that lessons the probability of continuing the fast trend down. A 50% retracement I've marked on the chart and is just marginally above the 1/3 mark. Moving above that level will be bullish but remains important resistance. A move above the 3/4 mark would be bullish at 5896.
LET'S LOOK AT THE S&P 500 INDEX ALSO A WEEKLY CHART

The chart below is the last drive up and you can see the 50% retracement was also the start of the last drive up. I was troubled by the weakness of that last drive and it is difficult to believe the index is going to charge through price levels that were so difficult the previous three months. If the index can move above the 1287 price level or ¾ of the range, which would also be a 50% retracement, will surprise me. Wednesday looks like it could be the high day for the week. Personally I believe this index is going to move sideways now until either the 7th or the 22nd.
If the metal and oil are going higher this is the week to prove it.
CNBC ASIA
When the world markets were at their high there were all simultaneously all at critical resistance levels and last week they all came down to support levels simultaneously.
LET'S LOOK AT THE ALL ORDINARIES AUSTRALIAN INDEX

Last week I put this chart up and said the index was going to the 3/8-price level of 4949 and would bounce. The nature of that bounce or rally would indicate whether this was the start of a bear campaign or whether the move down was a correction within an ongoing bull campaign. The index has hit that level and is now in a rally phase. This price range division of 1/3 to 3/8 holds a trend intact for another up leg. Unfortunately this index or any market will bounce off this level even if the trend is down. But remember in all instances this is the level that can keep an up trend intact.
LET'S LOOK AT THE LAST RANGE DOWN

In order to find the resistance for this rally and to make the determination if it is a counter trend rally or a resumption of the trend one of the things we will look at are the retracement levels. If it cannot move above the 1/3 to 3/8 level it could indicate a counter trend rally. This index has a history of trading to 50% levels and if that can be exceeded it would be bullish. The ¾ mark from the previous chart is likely to be the resistance if the trend is down and that was at 5084. One should also keep the last range the index is trading within in mind and most of the time that is the stronger resistance levels at 5048 and 5124 to 5148. Moving above those levels would indicate a new high is probable.
So by next week we should be able to qualify whether these are corrections within an ongoing bull campaign of whether this rally is a counter trend. All the world indexes came down to price levels that keep their trends in place.
LET'S LOOK AT THE CRUDE OIL MARKET

A year ago when the oil complex exhausted I indicated the market was likely to go into a large sideways pattern rather than reverse trend. You can see the sideways pattern has gone on for all of 2005 and 2006 so far and that is enough time to look for a directional move to start. There have been three drives within the sideways pattern and that usually indicates the next move could break out of the pattern. The move down from the last high has been a struggle down and the last low was 30 days from high so there is a chance this could start a trend up. It needs to move up above last weeks high for the first indication it could trend up.
The corrections in the metals still appear as corrections from an exhaustion but nothing yet to indicate a completed trend. The Nikkei came down 45 days into low and that infers the next important point is June 6th. It is possible to move up into that date from here.


