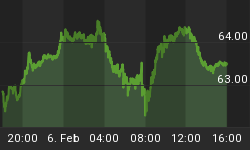
A move has started whereby gold shares can outperform the bullion price and, following such a pattern that completed recently, senior gold stocks have enjoyed rallies ranging from 28% to 40%.
Our unique work on the history of financial markets has enabled some timely calls. Some of this research was done in the 1970s and some in the 1990s.
This paid off in 2000 when in January we outlined the probability that the tech bubble would blow out in March. Then the ChartWorks, using the Post-Euphoria Model which was based upon the 1989 (Tokyo), 1980 (Gold), and 1929 (Stocks) extravaganzas, anticipated the low to be in late 2002. A cyclical recovery would follow.
In March of this year, it looked like gold and silver could do a blowout spike and we turned to our studies on the gold/silver ratio. At the conclusions of the powerful rallies in 1980 and 1974, the gold/silver ratio, which had been declining, reversed to increasing some three weeks before the top.
This time around, the ratio reversed on April 19, which suggested that both gold and silver would peak in the week centred on May 10. The high was on May 11.
The feature of the high was intemperate goldbugs being overly excited about soaring commodities and the plunging dollar. On the constructive side, if there were no crazed interventionist economists dedicated to depreciation there would be no goldbugs.
The prospect is appealing but, ultimately, we live in a real financial world that is often not in accord with the establishment of orthodox economists and goldbugs.
For example, the latter spent most of 2004 and 2005 raving about the weak dollar and the soaring nominal price for gold. The problem is that the price of gold was not keeping up with the cyclical bull market in commodities.
This showed up as our gold/commodities index began a significant decline in June, 2003 and gold stocks began a bear market in December, 2003. The reason wasn't "discovered" until gold mining suffered rising costs due to soaring commodity prices. Earnings reports were disappointing.
Unfortunately, this has not been relieved so far this year. Since January, the gold/commodities index has declined from 241 to 205. This is a significant decline and operating margins won't materially improve until this indictor turns up.
Fortunately for this industry, changes in the financial markets are suggesting that this depressant could soon ease.
Throughout all of financial history, gold has underperformed commodities during a business boom. More specifically, this has been the case since the advent of financial manias with the South Sea Bubble that blew out in June, 1720.
The pattern has been that gold's real price has declined with each big inflation in tangible and financial assets. Until our own experience now, there had been five such eras and in four examples the consequence was a long 20+ years period of increasing gold prices.
The point to be made now is that this positive period for gold starts with a mania in the orthodox financial world, with gold's real price at a significant low.
This mania in orthodox items has included the full panoply of stocks, lower-grade corporate bonds, real estate, and commodities. With a fair amount of drama, this has been changing since the week centred upon May 10.
Of course, the explanation of why gold's real price declines with a boom and increases with the consequent contraction is very simple. No matter what the establishment says, gold is money and, what's more, gold knows it.
Think of it in another way. During a boom, with soaring prices money loses purchasing power and during a contraction the purchasing power of money increases.
And - trust history - when the real price of gold increases gold miners make money.
In turning to the near term, the question about when this gets underway is paramount.
On gold shares and gold's nominal price, the ChartWorks anticipated the technical conditions needed as well as the date (June 13) for the potential low. That was some 7 weeks before the event and the low for gold's nominal price was 362.3 was set on June 14 with the targeted technical conditions.
On the financial side, what will confirm the next advance in the nominal and real price will be gold shares outperforming the bullion price and an extension of the modest trend in widening credit spreads. A more immediate influence would be provided by the resumption of treasury curve steepening. On this - the real model - gold can rise in most currencies, including the US dollar.
Most of this is close to starting. Investors and traders can aggressively buy gold and gold shares. On the latter, the recently floated gold mining ETF (GDX) provides an outstanding gold instrument. Managed by the experienced team at Van Eck (www.vaneck.com), the fund includes exposure in the exploration sector. Prudent central banks will continue to add to their gold reserves.


