


Crude Oil - Short Term

My Short Term view of Crude Oil is built around observations on the daily price chart going back several months.
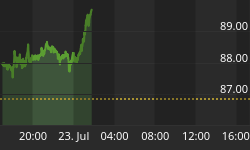
One characteristic of crude Oil that fascinates me is how price action seemingly moves in cycles that last about 6 weeks give or take. On the above chart, I have added some green arrows to indicate these various cycle tops. Note, that when we post a cycle top, the ensuing decline in Crude prices can sometimes be only a few dollars a barrel and sometimes much more. Also note that the ensuing decline can sometimes take only a few days and sometimes it can last a couple weeks. What determines the magnitude of these corrections seems to be a complex blend of politics and fear. Watch these cycles develop, anticipate them and use them to your advantage.
I do not try to use these cycles to trade Crude Oil futures. Rather, I tend to use them to assist me with trading energy related equities. As we work through a cycle top, I have noted that energy related equities can cool off and present better buying opportunities.
We now are at the juncture where we should be seeing one of these cycle tops. We have made it through the July 4th holiday week-end which typically represents the peak hurdle for gasoline demand. Problems noted last week with the Calcasieu Shipping Channel in Louisiana have now been resolved and the affected refineries are again producing gasoline. I noted above that these cycles tend to be related to politics and fear. The politics and fear factors at work right at the moment are three-fold: (1) what the Iranians decide to do with their Uranium enrichment activities and (2) how badly does the Israeli army decide to pummel the Palenstinians in the Gaza Strip and (3) does the turmoil in Palestine stir up angry Muslim sentiment elsewhere in the Middle East ? These issues shall determine the extent of any price pullback.
However, even though this cycle may be ending, this does not mean the energy markets are ending. Six or so weeks from now when we are again making some semblance of a cycle top, we could well see ourselves at prices that are above any previous highs. As we work through what should be a cycle top watch the energy stocks to see if they pull back slightly to offer you a better buying opportunity.
For the week, inventory data shows that Crude Oil stocks fell by about 2 million barrels. But, we are still very much above the average data range, so there should be no immediate worry about running out of Oil. As I noted above, issues in the Middle East are (and will continue to be) the concern.

Gasoline - Is there a Shortage ?
The next charts are interesting ones. It seems each summer there is a flurry of concern over gasoline. Are we running out? Can the refineries keep up? So far, this summer has been no exception.
A close look at the following chart shows right now we are well within the average range of gasoline inventory stocks. So no worries.

And has the consumer scaled back on his consumption of gasoline ? Not a chance. The following chart tells the story. In fact, gasoline demand is up this year over what we experienced last year. This speaks to the resilience of the consumer.

And how are the gasoline producers coping with demand? Are they keeping up? Indeed they are. The following chart shows that gasoline production is running at a pace well above what we experienced in 2005. So any fears that there is a production shortage can be dismissed as folly.

The following chart shows that gasoline imports are down lately in response to domestic producers being able to keep up with demand.
So, if production is keeping up with demand….why then are prices so high at the pumps? Economics 101 would argue that if supply is meeting demand we should not have high prices. I will leave this "politically charged and loaded" question for readers to ponder. I invite your feedback.

Natural Gas - Short Term

My Short Term view of Nat. Gas is built around observations on the daily price chart going back a few months.
For the past few weeks I have been pointing out that price action has been confined to a descending wedge. This week we broke out the bottom of this wedge. Not a very welcome event. Generally speaking, markets falling out the bottom of such wedges end up going sharply lower. So, now the question is how much lower? I almost hate to say this…but we could see $5.00 Natural Gas as this price level represents a thin shred of support on the longer term charts going back to October 2004. If seeking to trade Natural Gas Futures right now, my advice remains the same as last week - hands off !!. Wait until you see the 9 period RSI hook up and cross the "50" level. Then, and only then should you get friendly towards Natural Gas.
The following storage data goes a long way in explaining this price action. We have 425 Bcf more in storage than last year at this time. We are 591 Bcf above the 5 year average level.
Storage Highlights:
Working gas in storage was 2,615 Bcf as of Friday, June 30, 2006, according to EIA estimates. This represents a net increase of 73 Bcf from the previous week. Stocks were 425 Bcf higher than last year at this time and 591 Bcf above the 5-year average of 2,024 Bcf. In the East Region, stocks were 332 Bcf above the 5-year average following net injections of 50 Bcf. Stocks in the Producing Region were 196 Bcf above the 5-year average of 648 Bcf after a net injection of 17 Bcf. Stocks in the West Region were 64 Bcf above the 5-year average after a net addition of 6 Bcf. At 2,615 Bcf, total working gas is above the 5-year historical range.


