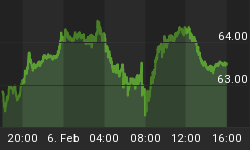
The Dow Industrials completed their third triple-digit loss in a row, and are down over 4 percent over the past three days. This is what happens with wave threes, which is why we spend so much time watching for them. This one isn't over. The first sub-wave down within it may be close to completing, but there are five waves to an impulse, and we are just finishing the first one.


The Dow Industrials followed the path of our Alternate count from last weekend, meaning the Broadening Top pattern was in play and a top was in on July 6th at 11,257, which was pretty close to the 11,299, .618 retrace target for wave 2 up (of wave 1 down). Wave 1 down fell about 1,000 points from May 11th through June 14th. Wave 2 up was a 3-3-5 Flat pattern that retraced 560 points. Wave 3 down started out slow, which is not unusual for tops (bottoms generally spike down then immediately bounce, whereas tops sort of roll over), and gave a hint that it was going to be a nasty decline when the c-up wave for {ii}-up truncated, meaning it failed to reach above wave a-up. That also served to fake-out the wave count, giving the impression of an overlapping complex wave 2-up that needed one more rally to finish. Truncated tops tell us that the coming decline will be strong, and this one has been. Confirmation of the count came when all three of our Blue-Chip key trend-finder indicators generated "sell" signals.
So, where are we, and what's next? Well, the above chart shows that four of the five subwaves for nano degree wave {iii} down have completed, meaning there is likely one more decline coming early next week -- wave 5-down, maybe a hundred points +/-, to a wave {iii} bottom. But here is the problem: This week's huge drop is a small degree sub-wave of another sub-wave of Micro 3 down. Wave {iv} up is near, as suggested by the "percent above 5 day" indicator. That isn't going to be much of a bounce, maybe 100 to 150 points, in that ballpark. Then another wave down, wave {v} down should take the Dow Industrials to a wave {1} bottom in the 10,400 +/- vicinity. But think about this. This coming bottom is just the first leg down of an eventual five-wave impulse decline for Micro 3 down. Micro 3-down's bottom may be the turn we get at the August 14th phi mate date. Maybe. If wave 3 down is a Fibonacci 1.618 of wave 1 down, we are talking a bottom for wave 3 around 9,700. Worse, after an August relief rally, we will be set up for another steep decline in the fall, as equities work their way lower into the 4 year and 8 year cycle lows due in late 2006, or early 2007.

The DJIA 30 day Stochastic, shown above, has its Fast measure at 16.67, below the Slow at 40.67. Take a minute and study this chart. Notice that it ignores the tiny moves, the fake-outs, and only signals when the significant new trends occur. This is gold if you are a trader. Gold. Every signal gave you at least a 2 percent move to play, which is a huge potential profit in the options world. Now, we are not guaranteeing a 2 percent move, 100 percent of the time, however, if you only speculate with what you can afford to lose, and use stop losses, and set a reasonable target for profits, the majority of the time you should win. The Dow Industrials are down 311 points since this indicator generated a "sell" signal.
This week is FREE Week at www.technicalindicatorindex.com. Why not visit and check out the many market analysis features that can help you make money. Simply go to the website and click on any button that interests you on the Home page. Don't miss this weekend's expanded market newsletter at the weekend button.
"Jesus said to him, "I am the way, and the truth, and the life;
No one comes to the Father, but through Me.
John 14:6
If you would like to see more of this analysis, to receive a Free 30 day Trial Subscription, simply go to www.technicalindicatorindex.com and click on the "Free 30 Day Subscription" button at the upper right of the Home Page. Once subscribed, you will have access to our remarkable buy/sell signals on the blue chip Dow Industrials and S&P 500, NASDAQ 100, and HUI Amex Gold Bugs Index. A subscription also gains you access to our daily Market Analysis Newsletters, Traders Corner, Guest Articles, and our Archives. We now offer Multiple Payment Options at the Renew Today! button at www.technicalindicatorindex.com, with subscriptions as short as one month, or as long as you'd like.


