


The good news is:
• The end of the coming week should bring some seasonally induced relief from the recent weakness.
Short term
Support and resistance levels are price points where reversals often occur or there is some "congestion" before the price level is breached. Many of the major indices are at or near easily identifiable support levels.
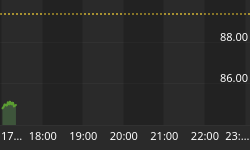
All of the charts that follow cover the past year with vertical dashed lines drawn on the 1st trading day of the month. Prices are shown as a high, low, close bar chart with up days shown in green and down days shown in red.
The first chart shows the Russell 2000 (R2K) which bounced off the support level, established last December, in June and then again last Tuesday and Wednesday. It fell on Thursday and Friday to close right at the support level.

The next chart shows the S&P 500 (SPX) following a similar pattern, but closing about 1.5% above the support level on Friday.

The last chart shows the NASDAQ composite (OTC), the worst performing of the major indices. The OTC fell through the June support levels and closed Friday about 1% below its lows of last October.

The blue chips are slightly above their support levels while the small caps are at or below their support levels. Next week should be interesting as these levels are tested.
Intermediate term
New lows diminish quickly after a bottom has been reached giving us the best indicator of bottoms.
The chart below shows the OTC in red and a 10% trend (19 day EMA) of NASDAQ new lows in blue (OTC NL). OTC NL is plotted on an inverted Y axis so increasing new lows move the indicator downward. The indicator has been moving downward for the past 3 months with breaks at the seasonally strong end of month - beginning of month periods.
The indicator is at its lowest level in well over a year and heading sharply downward.

Seasonality
Next week is the week following options expiration Friday in July during the 2nd year of the Presidential Cycle.
The tables below show daily returns for the OTC from 1966 - 2002 and S&P 500 (SPX) from 1930 -2002 during the 2nd year of the Presidential Cycle. There are summaries for both the 2nd year of the Presidential Cycle and all years combined beginning with 1963 for the OTC and 1928 for the SPX.
During the 2nd year of the Presidential Cycle the coming week has had an average negative return of nearly 1% as measured by both the OTC and SPX. Measuring the week over all years since 1928 the SPX has had a very modest positive bias while the OTC since 1963 has been decidedly negative.
Report for the week prior to the 4th. Friday in July
The number following the year is the position in the presidential cycle.
| OTC Presidential Year 2 | ||||||
| Year | Mon | Tue | Wed | Thur | Fri | Totals |
| 1966-2 | 0.42% | 0.08% | -0.10% | -0.56% | -0.05% | -0.20% |
| 1970-2 | 0.01% | 0.13% | 0.46% | 0.38% | -0.22% | 0.76% |
| 1974-2 | 0.03% | 1.39% | 0.26% | -1.50% | -0.93% | -0.75% |
| 1978-2 | -0.01% | 0.16% | 0.56% | 0.52% | 0.56% | 1.79% |
| 1982-2 | -0.05% | 0.44% | 0.42% | 0.30% | 0.03% | 1.13% |
| 1986-2 | -1.33% | -0.73% | -0.32% | 0.15% | -0.19% | -2.43% |
| Avg | -0.27% | 0.28% | 0.27% | -0.03% | -0.15% | 0.10% |
| 1990-2 | -2.33% | -0.47% | 0.65% | 0.00% | -0.64% | -2.79% |
| 1994-2 | 0.17% | -0.46% | -0.91% | 0.32% | 0.23% | -0.64% |
| 1998-2 | 0.12% | -1.90% | -0.79% | 2.02% | -2.46% | -3.01% |
| 2002-2 | -2.77% | -4.18% | 4.98% | -3.89% | 1.78% | -4.08% |
| Avg | -1.20% | -1.75% | 0.98% | -0.39% | -0.27% | -2.63% |
| OTC summary for Presidential Year 2 1966 - 2002 | ||||||
| Avg | -0.57% | -0.55% | 0.52% | -0.23% | -0.19% | -1.02% |
| Win% | 50% | 50% | 60% | 60% | 40% | 30% |
| OTC summary for all years 1963 - 2005 | ||||||
| Avg | -0.46% | -0.23% | 0.17% | 0.03% | -0.16% | -0.65% |
| Win% | 35% | 51% | 57% | 63% | 58% | 44% |
| SPX Presidential Year 2 | ||||||
| Year | Mon | Tue | Wed | Thur | Fri | Totals |
| 1930-2 | 0.51% | -0.78% | -2.63% | 0.62% | 0.00% | -2.29% |
| 1934-2 | -3.71% | -1.10% | 0.89% | -7.83% | 0.00% | -11.75% |
| 1938-2 | 1.90% | 2.59% | -1.10% | 0.08% | 0.00% | 3.46% |
| 1942-2 | 0.69% | 0.23% | -0.34% | -1.37% | 0.00% | -0.80% |
| 1946-2 | -0.28% | -3.01% | 0.12% | 0.52% | 0.57% | -2.09% |
| Avg | -0.18% | -0.41% | -0.61% | -1.60% | 0.57% | -2.69% |
| 1950-2 | -0.63% | -1.43% | 0.23% | 1.33% | 1.09% | 0.59% |
| 1954-2 | -0.27% | -0.47% | 0.64% | 0.80% | 0.13% | 0.83% |
| 1958-2 | 0.38% | -0.40% | 0.28% | 0.21% | 0.64% | 1.11% |
| 1962-2 | -0.02% | -0.77% | 0.18% | 0.55% | 0.76% | 0.69% |
| 1966-2 | -0.10% | -0.76% | -0.95% | 0.01% | -0.13% | -1.93% |
| Avg | -0.13% | -0.77% | 0.07% | 0.58% | 0.50% | 0.26% |
| 1970-2 | -0.22% | 0.15% | 0.35% | 0.04% | -0.03% | 0.30% |
| 1974-2 | 0.32% | 1.00% | 0.40% | -1.19% | -1.88% | -1.34% |
| 1978-2 | -0.03% | 0.74% | 0.65% | 0.46% | 0.46% | 2.28% |
| 1982-2 | -0.31% | 0.73% | -0.11% | 0.04% | -0.27% | 0.09% |
| 1986-2 | -1.75% | -0.62% | 0.87% | -0.20% | -0.51% | -2.21% |
| Avg | -0.40% | 0.40% | 0.43% | -0.17% | -0.45% | -0.18% |
| 1990-2 | -1.74% | 0.14% | 0.37% | -0.33% | -0.69% | -2.27% |
| 1994-2 | 0.23% | -0.30% | -0.50% | 0.22% | 0.11% | -0.23% |
| 1998-2 | 0.57% | -1.49% | -0.44% | 1.57% | -1.94% | -1.73% |
| 2002-2 | -3.29% | -2.70% | 5.73% | -0.56% | 1.69% | 0.86% |
| Avg | -1.06% | -1.09% | 1.29% | 0.23% | -0.21% | -0.84% |
| SPX summary for Presidential Year 2 1930 - 2002 | ||||||
| Avg | -0.41% | -0.43% | 0.24% | -0.26% | 0.00% | -0.86% |
| Win% | 37% | 37% | 63% | 68% | 53% | 47% |
| SPX summary for all years 1928 - 2005 | ||||||
| Avg | -0.12% | -0.11% | 0.28% | 0.07% | -0.02% | 0.10% |
| Win% | 38% | 51% | 62% | 65% | 58% | 55% |
Conclusion
We may see support hold near the current levels, otherwise there is no evidence of a bottom.
I expect the major indices to be lower on Friday July 28 than they were on Friday July 21.
This report is free to anyone who wants it, so please tell your friends. They can sign up at: http://alphaim.net/signup.html. If it is not for you, reply with REMOVE in the subject line. The major indices were mixed last week with the blue chip indices up and the small cap indices down so I am calling last weeks negative forecast a tie.


