


Dow Jones Industrial Average 11,051
Value Line Arithmetic Index 1,925
30-Year Treasury Yield (TYX) 5.10%
20+ Year Treasury Bond Price (TLT) 85.28
Gold 1/10 Ounce (GLD) $61.14
The Big Picture for Stocks
The 4-year cycle calls for a bear market bottom in 2006.
Technical Trendicator (1-4 month trend):
Stock Prices Up (New, see below)
Bond Prices Up
Gold Price Up
Our Technical Trendicator for stocks gave a buy signal today July 24. One key factor is one of the psychology indicators we follow, the American Association of Individual Investors (AAII) sentiment survey of the percentage of bulls. It dropped to only 24% this week. I have also noted that a large percentage of money managers and analysts on CNBC have given bearish views lately. Always looking for the contrary view, these are indications that the market is sold out near term.
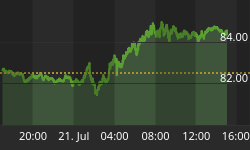
In addition, the stock price trends have turned upward. Note the chart below.
It is not likely that this is the end of the bear market. I expect another drop to new lows later in the year as we get further weakening of the economic data, especially from the consumer sector. But for now, things look OK. The chances of a pause by the fed is very high now, which would be more fuel for a rally.
Accordingly, in the Special Situations portfolio we are liquidating some but not all of our bearish positions. Sell the long position in the Rydex Inverse Mid-cap (RYMHX, 40.64), and cover the short position in the S&P Smallcap 600 (IJR, 59.12).
Just a note about one of the issues on our Ducks of the Dow list -- Merck. Merck is on two of our four quarterly buy lists. It has been the talk of the town on CNBC lately. It is treating us well as we got in cheap a few months ago.


