Dow Jones Industrial Average 11,088
Value Line Arithmetic Index 1,915
30-Year Treasury Yield (TYX) 5.09%
20+ Year Treasury Bond Price (TLT) 85.40
Gold 1/10 Ounce (GLD) $62.71
The Big Picture for Stocks
The 4-year cycle calls for a bear market bottom in 2006.
Technical Trendicator (1-4 month trend):
Stock Prices Up
Bond Prices Down (New, See Below)
Gold Price Down (New, See Below)
Markets
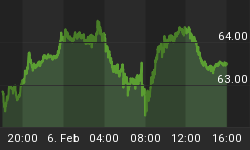
Our Technical Trendicator model has turned bearish for bonds and gold! We have caught the recent upswings in both of these markets for nice trading profits. But now the indicators are to sell. The chart below for gold shows what is happening for the yellow metal. I'm not sure I can analyze why these signals have occurred; I'm only going with the flow. Our Technical Trendicator is a trading model focusing on the 1-4 month time frame.
Special Situations
The positive trend for stocks is holding on for now. So we will be featuring 4 microcap stocks this week that appear to have extraordinary potential.
Update on TIPS
Since recommending the Treasury Inflation Protected Securities on July 9, values for these securities have risen approximately 1.75%. This is about 18% annualized. And this does not include any interest earned. I hope some of our subscribers got in on these when we suggested them. But it may not be too late. They still represent a potentially good diversification in a fixed-income portfolio. I consider these securities as core holdings irrespective of what the bond market does.


