


Close to two months have passed since my last commodities report on July 9th. At that time, gold staging a rebound after its precipitous decline from its multi-year high, and I was speculating aloud as to whether gold and the rest of the commodities had put in tops. So far, clarity remains elusive. Things don't always unfold as quickly as we'd like to see them to in the market, but each day brings new clues to examine and ponder. Let's see what the market has had to say over the past two months: (Charts and data through Friday August 25)
US Dollar
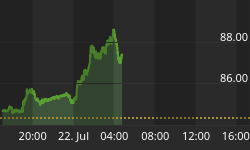
This time we'll start with the dollar, as it is still the measure of all commodities. I had been expecting at least a short-term rally in the buck, for the reasons detailed in my article, The Case For a Rising Dollar.

We had a false start with a nice rally to 87, but that collapsed into new intermediate lows. A shallow uptrend on the daily chart remains intact. The net result is that there has been very little significant movement, basis the September dollar index. But there is at least one encouraging sign: Though the buck has thus far refused to rally, it has likewise refused the all out collapse that seems unanimously expected. Instead, it has managed tenaciously to cling to critical support in the 84.5 - 85 area. It is also worth noting that each time the world is threatened with "terror" (the latest incident being the UK liquid plane bombing incident), the dollar seems to like it, and rallies.
Gold
Next, let's take a look at gold, the anti-dollar.

A month ago, gold was just approaching the 50% retracement level from its multi-year high, and looked ready to turn down. It managed to make it all the way to its 2/3 level retracement, but then collapsed back to support around 600. This was followed by another weak rally - not quite as high as the last - and now it's headed back towards 600. Whether it breaks or bounces at that level should tell us pretty clearly which way gold is going, at least in the intermediate term. At this point, the rally kind of has a dead cat bounce feel to it.
Oil
The news a few weeks back that BP was going to have to shut down its Prudhoe Bay operations caused oil to jump $2 in one day, to $77. That was a big move, but curiously, the news wasn't enough to push oil to a new high. In fact, the price of oil actually turned down the next day, and has since fallen nearly 10% from it's high, back to support around $70. But IF world oil supplies are as tight as they say they are, and IF demand is as strong as they say it is, and IF we're at or have already passed peak oil, I would have expected news of the shutdown - remember, this is 4% of America's output - to have caused the price to really start to run away. The BP news came right at the time of peak tensions in the middle east, yet oils still couldn't manage a decent rally. From a bullish standpoint, something here is not right.

Remember last year the price of oil peaked just when the news looked the worst -- right when Katrina hit. But here we are again, a full year later and prices are about the same. The summer driving season is over, winter is still some time away and we've hit a period of relative calm in the Middle East. Looks like we should be entering a relatively dead period for oil.
Sugar
I'm going to highlight sugar and corn this time because I believe that the market recently has been viewing these two as energy plays -- potential quasi-substitutes in the event of runaway oil prices. (By using sugar to produce ethanol, Brazil has been able to wean itself off imported oil, and is completely energy independent. The US could do it too, if our government had the independence, political will and backbone to stand up to Big Energy. But at this point in American history, Big Energy has its fingers so deep in the running of the country that any such policy is simply impossible. If the first American Revolution was fought in part to win the separation of church from state power, no doubt the second will be fought for the separation of corporate from state power. But I digress.)
At any rate, the price of oil is under control. High, yes, but it is not running away to $100 per barrel and beyond. (I even wonder if BP's news wasn't manufactured to keep the price high, because high prices are good for Big Energy, and they (President Texas and VP Oil) are running the country. But that would be a conspiracy theory http://www.youtube.com/watch?v=N5I7NFracPU , and we are told not to tolerate conspiracy theories. So we shouldn't) At any rate, take a look at what happened to sugar:

Terrible, isn't it? Ugly. Probably what the US housing market is going to look like next year. But this is good for Brazil - they've got cheaper energy, good for anyone who was short sugar, and good for people who like sweet treats like donuts and candy, like many Americans.
Corn
Last year when corn was plentiful, and the price of oil was high, corn burning stoves looked to be all the rage. Manufacturers sold out of them and had waiting lists a full year long. This, and considerable ethanol hype also helped corn to post a modest rally since last December. It looked like the start of a new bull market in corn, but the rally has since made a complete round trip, and corn is back to where it started last December. Like sugar, prices began their collapse in the middle of July (chart not shown). If my thesis is correct, that the market has been viewing sugar and corn as quasi-oil substitutes, then we shouldn't be expecting $100 oil anytime soon, and the rallies in sugar and corn are finished.
For an excellent Elliott wave analysis of the price of oil, with biting commentary that only Robert Prechter can provide, see EWI's free report: Is the Price of Oil Really High? (Sign in required) Here is a hint as to what the report has to say about peak oil's impact on humanity:

Copper
How does that old saying go? Every economic expansion has a copper roof on it? Something like that. Maybe some old timers out there remember how the saying. The point is that as the economy starts to overheat, the price of copper goes up and puts a damper on economic activity. Copper is used extensively in building - copper wires and pipes in housing. We don't need to be reminded of how the US housing market is going. When we see copper topping out, the end of the expansion is nigh. Commodities cannot rise on speculation alone. The boom relies on a continued economic expansion to make it real.

Copper's chart looks a lot like gold's - it speaks for itself. Like with gold, it is break or bounce time - either it will bounce once again off of it's support zone, or break down through it. Same story for the CRB Commodity index. By the time I write my next update in a month or so, we should have some added clarity. (Sign up here if you'd like to be notified) In the mean time, you can follow along yourself with this excellent source for free commodity charts on my website.
The bottom line is that, it looks like the tops are in for the year, at least to me. Further evidence - here come the Japanese, rushing into the commodity market:
TOKYO (Reuters) - Commodity markets, long shunned by cautious Japanese investors as too risky, could see an inflow of billions of dollars in the next few years as financial firms in the world's No. 2 economy hike exposure in hopes of big returns.
How does that other old saying go? The top isn't in until the Japanese start buying? Well, someone's gotta get stuck holding the bag at the end...
Next week, a technical analysis of the stock market and outlook for its direction for the rest of the year. Sign up here to be notified.


