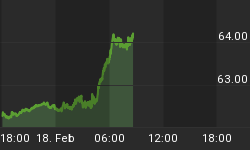
Since our HUI 30 day stochastic proprietary key trend-finder indicator generated a "buy" signal on August 21st, the HUI rose 25 points, or 7.2 percent. That is useful if you like trading this index, or trade its exchange traded fund, symbol GDX. Our key trend-finder indicators include the 30 day Stochastic and the Purchasing Power Indicator. The 30 day Stochastic measures breadth momentum, while the PPI measures supply and demand momentum. Aggressive traders lean on the 30 day Stochastic, while conservative traders add the PPI as a filter. When using the PPI as a filter, when both indicators are first in agreement, that is either a "buy" or a "sell" signal. If they disagree, we consider that a "sideways" signal. These are entry signals. Profit targets are set for exiting based upon one's risk appetite, trading experience, and financial position.


As of Friday, September 8th, our key trend-finder indicators remain on a "sideways" signal Friday. The HUI Purchasing Power Indicator fell to 194.82, remaining on its "sell" signal from September 7th. The HUI 30 day Stochastic Fast comes in at 50.00, below the Slow at 68.52, but not quite decisively below, which requires it to be more than 20 points below, thus remaining on its "buy" from August 21st. The HUI Amex Gold Bugs Index fell 9.95 points Friday to close at 337.97. Volume was108 percent of its 10 day average, with all issues declining.
The value with Elliott wave analysis is we are making a map, improving it the further along we go, based on the latest information. It's a picture of where we are headed, but when is better left to the PPI and Stochastic signals. We supplement the "when" analysis with the percent above analysis, for potential early clues. We prefer to trade off our key trend-finder indicators, not off of Elliott Wave or other TA tools.
The EW labeling for the HUI shows that Intermediate degree wave 1 up completed on May 11th, and we since corrected into an Intermediate wave 2 bottom in June. Since then, the first leg up, Minuette i finished, and wave ii down extended as an Ascending Triangle. That pattern implies a sharp breakout north is coming, toward 400.00. The alternate labeling is that where we consider Intermediate 2's bottom is merely wave a down of 2, and what we have labeled as i up is merely b, which means a deeper retrace down has started, c down of 2 down. If the HUI drops below June 13th's 270 level, the alternate is occurring. But even if it does, a huge Intermediate wave 3 up would be next, and that wouldn't be more than a few months off from starting. Our signals will guide us regardless of which scenario is unfolding. If they both turn to "sells" next week, that would suggest the alternate labeling is occurring.

For a Free 30 day Trial Subscription, go to www.technicalindicatorindex.com and click on the button at the upper right of the Home Page. Check Out Our September Subscription Specials.
"And every spirit that does not confess Jesus is not from God;
and this is the spirit of the antichrist, of which you
have heard that it is coming, and now it is already in the world.
Greater is He who is in you, than he who is in the world."
1 John 4:3, 4


