


 In my September 23rd update I stated:
For the first time since the June lows, this market COULD have made its high, but doesn't have to just yet. The market has left us at Friday's close with a pattern that can go either way, in my opinion.
It did not leave me with enough clues to say whether it topped on Tuesday or if Friday's low was only a C wave of a flat within an ending diagonal. The good thing is we are really close to finding out, as the market should be tipping its hand by next week. I am in no rush to jump the gun, since the SPX was only able to close 14 points below its new high.
Boy, it sure paid off to have discipline! We came into the week thinking a market top was forming, but we couldn't find any confirmation. Monday morning they tried hard to break Friday's low but couldn't. It started to seem as a high had been put in, but we relied on some of our tools and saw instantly that it was a low! First, we had a CIT that I mentioned in the last two updates that was due on Sept 22nd. That CIT hit right at the due date causing a reversal of the prior week's trend. When they tried to break those lows on Monday and failed, it produced another sharp rally that stopped only points away from the Dow's all time high!
We then looked to my proprietary Trend Cycle charts which signaled to buy the low aggressively. These sets of charts are still in beta form, but I'm looking to release them to my members soon. Here is a link to take a peek at how it was possible to buy that low with confidence along with two oil charts. At this time, they get posted to the forum at important turns within the trading day.
Also, we had another magical chart to guide us. Mike was like a magician pulling a rabbit out of his hat this week! Mike (a.k.a. Merlin) is one of our Market Advisory members and had shared with us several months ago that he'd made many improvements to his program that was producing even better results. Since then, Mike has been red hot. Below is a chart- look how the S&P obeyed it this week! It too was looking for the low on Monday to hold. Mike is also working on a research project using two-hour forecasting charts that he will be sharing with us to use along with our Trend Cycle charts.

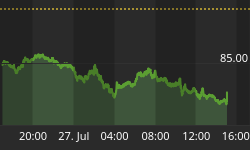
Courtesy of Chartsedge.com
Add the 3 to the fact that I had already thought we were only finishing a diagonal C wave on the 22nd, and we were able to buy that low. From there, we already had the upside target that was shown in last week's update of SPX 1333. We sat there and watched it rally in a straight line from 1311 to 1333, where it only rested for a few hours. The SPX did rally to about 1340, but closed out the week at 1335.85, basically at our target.
Now what? The things that I have said in the last few years are finally coming together. I've always thought the Dow would want to print a double top or take it out. This week puts us in that area. We are carefully monitoring what happens next week to see if we are close to any turn. The other ingredient that I have waited for is to have the last of the bears give up and turn bullish. Well, that has finally started to happen. Many concerned traders approached me this week expressing that this market was out of control and it might even try to see 1500 on the SPX.

The chart above shows the 1360 target that I've had along with arrows showing how price has been "vibrating" around these important Fibonacci areas as this rally travels to its target. Being that close to this target and having both bulls and bears chasing this market validates my thinking of a top being near.
The next chart shows some perfect turns that our resident Gann analyst had outlined well in advance. Data on this chart is only up to mid September. His next important turn lines up with the big picture ideas perfectly.

Once again, as of Friday night, there is no confirmation that a top is in. Actually, there is good reason to believe another move is still in the cards, even if only a slight new high. That would set up a perfect reversal pattern. If not, we have clear levels below the market to monitor that would suggest a top was in place if penetrated. Either way, we will monitor the markets starting with the opening in Europe on Monday, and then discuss our trading plans within the Forum. At this important juncture in the markets, we want to respect our members and keep our set ups and confirmation levels for next week within the forum. Besides, at this stage of the game, you shouldn't rely on week old ideas. This market can accelerate or turn on a dime at any minute. Constant updates throughout the day need to be seen to have successful trades.
The October issue of our New Market Newsletter will be out this weekend. Use the link to signup and receive the emailed update. Market updates Be sure to send the link to friends. The Monthly Newsletter is packed with Market analysis from many of our contributing Market advisory members such as: Jim Curry, Tim Ords, Glen Neely, Richard Rhodes, Andre Gratian, Bob Carver, Stan Harley, Chartsedge, Stock Barometer, and many more.
Sign up for a FREE TRIAL and decide if you can use our service as the markets might be gearing up for an even more exciting October.
 The markets now request constant analysis of their chart patterns and we continue to do that every day. We cover a variety of markets such as the U.S. and European Financial Markets, Currencies, Metals, Energies, Stocks and Commodities. We use methods like Elliott wave, Gann, Delta, and many proprietary indicators.
Market analysts are always welcome to contribute to the Forum or newsletter. Email me @ Dominick@tradingthecharts.com if you have any interest.


