• 1,028 days Will The ECB Continue To Hike Rates?
  • 1,028 days Forbes: Aramco Remains Largest Company In The Middle East
  • 1,030 days Caltech Scientists Succesfully Beam Back Solar Power From Space
  • 1,430 days Could Crypto Overtake Traditional Investment?
  • 1,435 days Americans Still Quitting Jobs At Record Pace
  • 1,437 days FinTech Startups Tapping VC Money for ‘Immigrant Banking’
  • 1,440 days Is The Dollar Too Strong?
  • 1,440 days Big Tech Disappoints Investors on Earnings Calls
  • 1,441 days Fear And Celebration On Twitter as Musk Takes The Reins
  • 1,443 days China Is Quietly Trying To Distance Itself From Russia
  • 1,443 days Tech and Internet Giants’ Earnings In Focus After Netflix’s Stinker
  • 1,447 days Crypto Investors Won Big In 2021
  • 1,447 days The ‘Metaverse’ Economy Could be Worth $13 Trillion By 2030
  • 1,448 days Food Prices Are Skyrocketing As Putin’s War Persists
  • 1,450 days Pentagon Resignations Illustrate Our ‘Commercial’ Defense Dilemma
  • 1,451 days US Banks Shrug off Nearly $15 Billion In Russian Write-Offs
  • 1,454 days Cannabis Stocks in Holding Pattern Despite Positive Momentum
  • 1,455 days Is Musk A Bastion Of Free Speech Or Will His Absolutist Stance Backfire?
  • 1,455 days Two ETFs That Could Hedge Against Extreme Market Volatility
  • 1,457 days Are NFTs About To Take Over Gaming?
Market Sentiment At Its Lowest In 10 Months

Market Sentiment At Its Lowest In 10 Months

Stocks sold off last week…

The Problem With Modern Monetary Theory

The Problem With Modern Monetary Theory

Modern monetary theory has been…

Is The Bull Market On Its Last Legs?

Is The Bull Market On Its Last Legs?

This aging bull market may…

  1. Home
  2. Markets
  3. Other

ChartWorks: Gold Update

Originally published by Institutional Advisors on October 4, 2006.

Technical observations of RossClark@shaw.ca.

Gold's rally to $607 last week satisfied the minimum interim upside targeted resistance of $600-$610, but came well short of the $626 that would be needed to confirm a major breakout. The subsequent break of support now requires an update in the analysis.

Over the years, gold has shown a tendency to make 50% to 60% retracements within rising and declining trends. In the early stages of a trend these retracements tend to overlap the previous trading range, but fail to penetrate the midpoint of the prior consolidation. The rally into September 28th retraced 53% of the decline from the September 5th high of $640 and marginally overlapped the July 24th low of $602.

Now that prices have violated the September support we can lower the important upside resistance level from $626 to $588. A close above there would be viewed as a catalyst for a renewed bull market move. In the interim, resistance should be encountered on 50% to 60% retracement rallies of the break from $607.

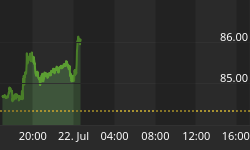
Examples of resistance

Here is what happens once prices move up through the midpoint of the 'last failed rally'.


Back to homepage

Leave a comment

Leave a comment