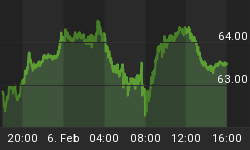
If there is one word to describe the trading climate of the past few days it would have to be "no conviction." There's an atmosphere of lethargy in the market right now, including for gold stocks, that is hard not to notice. One look at any number of the daily charts or tick charts of the leading gold/silver mining equities will bear this out. Take a look at the HUI tick chart below to see what I mean.
There has been a 4-day lateral trading range in the composite gold stock index and with not much volatility. Low volatility over a period of several days on diminishing volume typically precedes a sharp breakout type of move either up or down. On an immediate-term basis this is actually a positive psychological attribute (from a contrarian standpoint) as trader sentiment is very low right now on the mining shares.
What is needed is a substantial increase in upside trading volume to get something going in the way of a rally for the leading gold shares and to date this volume has been lacking. What could possibly bring in this needed increase in trading interest and corresponding volume increase in the gold/silver shares? A simple close decisively above 130 in the XAU and above 310 in HUI, where the 30-day moving average intersect in both charts, respectively, would more than likely do it. Even if HUI and XAU dropped back after this move, the computer trading programs and pattern traders would be forced to recognize it and respond accordingly. Then, following the next pullback and consolidation, the following rally would occur on even higher volume due to the increased in participation once the XAU and HUI have gotten everyone's attention.
One gets the feeling right now that everyone is essentially waiting on the sidelines for market to signal its next directional intent. Investors are generally afraid of making big commitments right now, and that in itself is a plus since it provides a psychological support (the best kind of support there is) beneath the market and limit the downside during period of weakness. The mild intraday reversal following HUI's sharp decline on Wednesday is but one example of this.

While there is some short-term turnaround potential in some key gold stocks, there is even more technical rally potential in the near term in many of the leading oil/gas equities. After that big decline in September following the August topping process and negative oil/gas correlation many oil and gas shares appear to have built enough of a short-term base to attempt the first relief rally since the September decline. As with the gold stocks, the first line of resistance for the oil stocks is the 30-day moving average. In the Amex Oil Index (XOI) this intersects the 1075 level with the XOI currently just beneath this as of Wednesday, Oct. 11. That level shouldn't prove to be too difficult to overcome. The real test of resistance for XOI is the 1125 level where the 60-day and 90-day moving averages pinch together in the daily chart. The 1125 area also represents the mid-point of the single biggest 1-day decline from September's correction and therefore adds to the technical significance. It will be worth monitoring on XOI rallies in the near term.
Our proprietary internal momentum indicators for the oil stock sector (OILMO) show that in the short-term internal momentum is reversing from down to up, particularly on a 20-day rate of change basis. This should provide the oil stocks with an undergirding of support as the recent basing patterns firm up and the next technical rally attempt is made. Some individual energy stocks worth watching for rally potential, based on chart considerations, are Sunoco (SUN), Valero Energy (VLO) and XTO Energy (XTO).

In the overall scheme of things there is much in the way of overhead resistance the natural resource stocks must contend with in the weeks ahead. How well the key stocks deal with the pivotal resistance levels we've discussed will be one indication of future upside potential beyond the near term, and a return of volume on rallies will be another. But the most important factor will be to see an expansion in the new 10-week highs, which in turn would push our internal momentum indicators higher and reflect an improving intermediate-term outlook.


