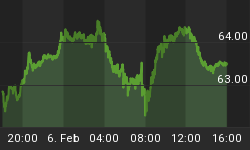
On Friday, the XAU closed above its 20-day moving average while breaking the downtrend line connecting its two September peaks. This serves as confirmation that the XAU and gold stocks did indeed bottom. The trend is now up.
Short-term resistance on the XAU is now at 131 and then 135. The 1/3 retracement level of the September-October bottom at 131 is also the point of the XAU's upper daily bollinger band. I think we're likely to see the XAU go up to this level and then pull back down into the 124-128 area and then proceed higher.
The next intermediate-term resistance level is the 140-145 zone - the point of the XAU downtrend line connecting the May and September peaks. Coincidentally this is also the area of the XAU's 150 and 200-day moving averages. This is my price target for the XAU and I think we'll see the gold stocks reach this level by Thanksgiving.
My plan is to hold my current gold stock positions, possibly adding on if we get a dip from XAU 131 bacl down to the mid 120's, and then to revaluate the strength of the gold stocks once we get to XAU 145. I don't want to lose my profits like I did during the September drop again so if I see signs ofa correction coming I am likely to sell some of my positions.

To look further into the future than Thanksgiving is tough. I have two scenarios in mind on how things are likely to unfold. But first, let's take a look at some interesting things going on in the charts. The current price pattern is similar to the pattern we saw in gold stocks from November 2004 into May 2005.
Gold stocks topped in November '04 when the XAU hit its upper 200-day bollinger band. It then had a sharp drop into February 2005 after which it rallied back up only to fail and make a new low in May which took the XAU back down below its 200-day bollinger band for a few days where it finally bottomed. The XAU then rallied up to its downtrend resistance line (long-time subscribers can remember how we talked so much about the XAU 95 level around that time) and then consolidated for about 3 months before breaking out and rallying up to and beyond its upper 200-day bollinger band.
Now, this year, once again we are seeing a similar pattern unfold as the XAU topped out in May when it went through its 200-day bollinger band. It then fell sharply into June and then rallied back up only to fail again and correct back down to its 200-day bollinger band. It actually fell through it again for a few days and then bottomed just like it did in 2005. Once again the dowtrend resistance line connecting its two recent intermediate-term peaks is likely to act as the target level for the current rally.
I feel very confident that we are going to get a rally up to the XAU 140-145 level. It is what happens after that which is difficult to forecast. There just isn't enough technical evidence or data to accurately do so. But there are two likely scenarios. First we are almost certain to get a pullback or a pause and period of several weeks of consolidation from this level. There are a lot of gold bears out there and if they happen to be right then this will be the ultimate peak for gold stocks and they'll come crashing down to start a new bear market.
If the bulls (like myself) are right, however, then the XAU should do something very similar to what it did in 2005 once it gets beyond the 140-145 level. This would be my second scenario. After pausing or having a quick pullback from there it will turn up and rally straight up to its upper 200-day bollinger band and 52-highs. It will then pause or pull back for a few weeks and go on to break through this upper bollinger band launching the next major leg up in the gold bull market.
And it's the reason I bought a position in gold stocks last week. Most of them are big cap liquid stocks. However, some of the best opportunities in gold stocks are in the smaller issues with real growth stories. So I am adding one new gold stock to the Top 10 List of Small Caps today. This company is way undervalued with a forward P/E of less than nine and gold production slated to go from 0 to over 170,000 ounces of gold over the next twelve months at $240 an ounce. Wall Street is totally asleep on this one: WSW New Small Cap Monster Stock Recommendation


