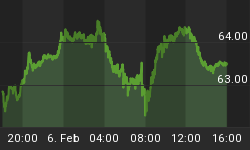
On Last Friday Rally the SELL PRESSURE, our Proprietary Indicator has reached extreme high again. Market has managed only one day of churning and started decline.
We updated our http://borisc.blogspot.com yesterday. See the notes about the "Freak Show".
Talking about Freaks... Our creator must have had his/her own brand of freak love for symmetry. Look at S&P top ( Mar-August 2000 ), bottom (Oct2002-Mar2003) and top?! May-Oct2006. So you tell me if the man/woman has no sense of humor?
Our prediction is that the top is near at the resistance points previously outlined. Now, please see the probabilities of dates for tops.
Oct 18 2006 ±2 days Probability 25%
Nov 03 2006 ±2 days Probability 50%
Nov 18 2006 ±2 days Probability 25%
Oh, yes, did you see the baby cup of BKX underflow? See your Favorite chart site.


