


The good news is:
• The Dow Jones Industrial Average (DJIA) hit an all time high last week and the NASDAQ composite (OTC) closed at a multiyear high on Friday.
Short Term
Last week the market recovered all of its losses of the previous week.
However, the number of new highs did not return to the levels of two weeks ago and Friday when most of the major indices were up the number of new highs decreased on both the NYSE and NASDAQ.
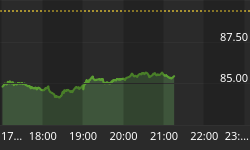
The chart below covers the period from mid April through last Friday and shows the OTC in magenta and a 10% trend (19 day EMA) of NASDAQ new highs in green (OTC NH). When the OTC hit a new high on Friday OTC NH fell to a level close to its low a week earlier. In addition, when the OTC hit multiyear high about two weeks ago the OTC NH was lower than it was at its previous high last spring.
The divergences are not great and there will probably be more new highs in the next few weeks, but the next few days are likely to be down.

Intermediate term
There are some rules of thumb regarding new lows that have been around a long time. They state there is little need to worry until there has been several consecutive days with more than 40 new lows on the NYSE and/or 70 on the NASDAQ. There is some reason to be dubious of NYSE data these days because of the high percentage of fixed income related issues on that exchange. We have not seen more than 70 new lows on the NASDAQ since August 15.
The chart below covers the past year showing the OTC in magenta and a 10% trend (19 day EMA) of NASDAQ new lows (OTC NL) on an inverted Y axis in blue. The Y axis has been inverted for OTC NL to make the indicator easier to read. Fewer new lows move the indicator upward so up is good.
The indicator usually begins moving downward several weeks before a final top. The indicator has been moving slightly downward since the beginning of the month, but the magnitude has been slight.

Seasonality
In the tables below next week is defined as the week prior to the 3rd. Friday in November during the 2nd year of the Presidential Cycle. Options expire on the coming Friday.
OTC data covers the period from 1966 - 2002 and SPX data from 1954 - 2002 during the 2nd year of the Presidential Cycle. There are summaries for both the 2nd year of the Presidential Cycle and all years combined beginning with 1963 for the OTC and 1953 for the SPX. The market traded 6 days a week prior to 1953 so that data is been omitted.
Historically the coming week has been similar to last week, during all periods the market has been up about half of the time with modest gains.
Report for the week prior to the 3rd Friday of November
The number following the year is the position in the presidential cycle.
Daily returns from Monday through options expiration Friday.
| OTC Presidential Year 2 | ||||||
| Year | Mon | Tue | Wed | Thur | Fri | Totals |
| 1966-2 | 0.18% | -0.35% | 0.90% | -0.11% | 0.75% | 1.37% |
| 1970-2 | -1.11% | -0.05% | -0.07% | -0.51% | -0.09% | -1.82% |
| 1974-2 | 0.32% | -2.04% | -0.58% | 0.09% | -0.97% | -3.18% |
| 1978-2 | -1.60% | -1.88% | 0.51% | 0.69% | 1.32% | -0.96% |
| 1982-2 | -1.41% | -1.91% | 1.24% | 0.67% | 0.06% | -1.35% |
| 1986-2 | -0.42% | -1.25% | -0.80% | 0.68% | 0.70% | -1.09% |
| Avg | -0.85% | -1.42% | 0.06% | 0.33% | 0.20% | -1.68% |
| 1990-2 | 2.78% | 0.40% | 1.13% | -0.68% | -1.02% | 2.62% |
| 1994-2 | 0.79% | 0.11% | 0.08% | -0.49% | -0.15% | 0.34% |
| 1998-2 | 0.74% | 0.91% | 1.00% | 1.18% | 0.44% | 4.27% |
| 2002-2 | -2.95% | 2.30% | 0.87% | 3.69% | -0.03% | 3.88% |
| Avg | 0.34% | 0.93% | 0.77% | 0.92% | -0.19% | 2.78% |
| OTC summary for Presidential Year 2 1966 - 2002 | ||||||
| Avg | -0.27% | -0.37% | 0.43% | 0.52% | 0.10% | 0.41% |
| Win% | 50% | 40% | 70% | 60% | 50% | 50% |
| OTC summary for all years 1963 - 2005 | ||||||
| Avg | -0.09% | 0.03% | 0.11% | 0.19% | -0.09% | 0.16% |
| Win% | 48% | 49% | 60% | 58% | 53% | 56% |
| SPX Presidential Year 2 | ||||||
| Year | Mon | Tue | Wed | Thur | Fri | Totals |
| 1954-2 | -0.21% | 0.30% | 0.18% | -0.56% | 0.03% | -0.27% |
| 1958-2 | 0.28% | -0.21% | 0.13% | 0.02% | -0.96% | -0.73% |
| 1962-2 | 1.38% | -0.22% | 1.18% | -0.32% | 0.32% | 2.34% |
| 1966-2 | -0.70% | 0.39% | 0.83% | -0.69% | -0.66% | -0.82% |
| 1970-2 | -0.16% | 0.12% | -0.66% | 0.14% | 0.98% | 0.43% |
| 1974-2 | 0.32% | -1.97% | -0.43% | -0.40% | -1.57% | -4.05% |
| 1978-2 | -1.73% | -0.69% | 0.24% | 1.08% | 0.76% | -0.34% |
| 1982-2 | -1.79% | -1.17% | 1.85% | 0.30% | -0.95% | -1.77% |
| 1986-2 | -0.53% | -2.64% | 0.37% | 1.85% | 1.57% | 0.62% |
| Avg | -0.78% | -1.27% | 0.27% | 0.59% | 0.16% | -1.02% |
| 1990-2 | 1.83% | -0.57% | 0.86% | -1.05% | 0.03% | 1.10% |
| 1994-2 | 0.80% | -0.22% | 0.13% | -0.44% | -0.45% | -0.19% |
| 1998-2 | 0.91% | 0.30% | 0.46% | 0.71% | 0.95% | 3.32% |
| 2002-2 | -2.07% | 0.77% | -0.05% | 2.46% | 0.61% | 1.73% |
| Avg | 0.37% | 0.07% | 0.35% | 0.42% | 0.28% | 1.49% |
| SPX summary for Presidential Year 2 1954 - 2002 | ||||||
| Avg | -0.13% | -0.45% | 0.39% | 0.24% | 0.05% | 0.10% |
| Win% | 46% | 38% | 77% | 54% | 62% | 46% |
| SPX summary for all years 1953 - 2005 | ||||||
| Avg | 0.03% | -0.06% | 0.11% | 0.09% | 0.00% | 0.17% |
| Win% | 46% | 43% | 66% | 51% | 60% | 53% |
Conclusion
Short term indicators show breadth deteriorated during last weeks rally.
I expect the major indices to be lower on Friday November 17 than they were on Friday November 10.
This report is free to anyone who wants it, so please tell your friends. They can sign up at: http://alphaim.net/signup.html. If it is not for you, reply with REMOVE in the subject line.
Last weeks negative forecast based on the weakness of the previous week was a miss.


