


Gold's Minor degree wave 4 Symmetrical Triangle, which is a consolidation pattern of the Minor degree wave 3 rally that started back in 2001 and extended into the May 12th, 2006 top, is still looking pretty good. Wave c down is complete, and it looks like wave d up finished this week, to be followed by a small wave e down. If prices remain above wave a's bottom, then this pattern should hold up and lead to a happy jaunt toward $900. If Gold rises much higher next week, we have to consider that waves d up and e down were smaller than labeled, are over, and the trek toward $900 has begun.


On the other hand, an alternate scenario (with diminishing probability) is that Gold may morph into a 3-3-5 Flat, meaning wave c down of 4 would drop toward 525ish or lower. If it drops much farther, then alternate labeling # 2 shown above is likely occurring, a one degree larger correction, Intermediate 2 down. But if that alternate is occurring, wave 2 down would be on its last leg, wave c down.
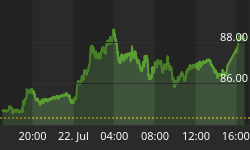
A look at the next chart shows the U.S. Dollar has formed a Head and Shoulder Top over the past few months. This pattern is technically strong as the right shoulder is weaker that the left. The minimum downside target per this pattern is 83.25. The neckline provided strong support Friday as the Dollar reversed back up to it after plunging intraday. A look at the charts on the next page show the Dollar has finished its descent into wave iii down, and is completing its Minuette wave iv corrective rally. Wave v down of Minor 1 down is next, where it should nestle around the 80 area +/-. A break below the bottom boundary of the triangle would suggest wave v down had started. All this is the start of a protracted move into the 60's, one that will be stair-step rather than freefall as Central Banks around the world work in orderly fashion to devalue the Dollar. There was just simply too much M-3 created over the past several years. This spells good fortune for precious metals long-term, of course. Short term, once wave 1 down bottoms, probably in the 80 +/- area, next will be a corrective wave 2 up, to be followed by 3 down that should send the Dollar into new territory on its journey toward the 60s.


Short-term, the small subdivisions of wave iv's Triangle completed its wave d-down wave, with perhaps another up sequence for e. A break below 85.00 suggests iv was not a triangle, simply a three wave correction, and v down is underway. There is an alternate possibility, that wave (2) up has not yet been reached, and is extending. It has the Dollar rising sharply toward 100. Frankly, the fundamentals do not support this view. This alternate labeling is legitimate as an Ascending Triangle has formed, which usually resolves to the upside. A rise above January 2006's low, above 87.83, will confirm the alternate labeling.
"While he was still speaking, behold a bright cloud
overshadowed them; and behold, a voice out of the cloud, saying,
"This is My beloved Son, with whom I am well-pleased; listen to Him!"
And when the disciples heard this, they fell on their faces and were much afraid.
And Jesus came to them and touched them and said,
"Arise, and do not be afraid."
Matthew 17:5-7
For a Free 30 day TrialSubscription, go to www.technicalindicatorindex.com and click on the button at the upper right of the Home Page.


