


Still going nowhere. Gold has declined 4 out of 5 days in each of the past two weeks. This has not happened since May of 2001 just as gold was starting its new bull market. What does it mean? Hell, who knows.
GOLD
LONG TERM
No use showing a long term chart this week as nothing much has happened to change the previous charts. The long term P&F chart has stayed as it was last week. The P&F chart is still under the influence of the bear with a projection that still remains in the $480/$490 area. We still require a move to $675 as a minimum to reverse trend but as mentioned before, due to heavy resistance at $675 a move to $690 would be a better indication of a reversal. From the P&F stand point it is still not an interesting market to be getting into. But what does it know? The usual indicators may be telling us something different.
Looking at the usual indicators, The week's activity still took place above the long term moving average line and the line is still sloping gently upwards (see chart below). The price touched the moving average twice during the week but remained above. Long term momentum is still positive but weak. As mentioned in previous commentaries, momentum looks more lateral than positive. The volume indicator has once more dropped below its long term trigger line for a negative reading but on the long term I would not jump to conclusions based upon the volume. It is more what's happening on the intermediate and shorter terms.
As mentioned last week, all in all, I will continue with my BULLISH long term position but keeping in mind that there is one major chart, the P&F, that is giving me an opposite story for now.
INTERMEDIATE TERM

Although we now have a down direction in the intermediate term P&F chart it does not signify anything. Here, we are still under the influence of a bullish intermediate term trend. The upside projection remains at $715, which would suggest that if the intermediate term projection pans out we will have a long term reversal to the bull side along with it. But I like to take things one week at a time and not jump the gun. Something will give with the P&F charts. We can't have both projections (long and intermediate term) occurring without a change in the other period.
As for the usual suspects, although the price action has been mostly on the negative side for the past two weeks we are still some distance above the positive sloping intermediate term moving average line. Although momentum slipped into the positive zone late last month it has really gone nowhere and is heading lower again. It will be interesting as to how long it can stay in the positive zone. As for the volume action, it has dropped below its trigger line and seems to be heading lower. The action so far this month sure looks like a topping action when everything is taken into account.
Although there are some negatives in the indicators, or at least some heading towards the negative, I will remain BULLISH for another week.
SHORT TERM

Although it is not easy to pick it up, and most would not even notice it, but for the past 2 weeks the price of gold declined 4 days each week and only advanced one day each week. I don't know if this means anything but we would have to go all the way back to the beginning of the bull market in 2001 before we find another similar situation (and you thought you'd never read any earthy shattering news in these commentaries). There were two other times when the price advanced only one day each week for two weeks but both of those times had holidays and we were missing a 5 day week. Looking at that two week activity it sure looks like a short term topping activity. The moving average (15 DMAw) has turned horizontal, ready to turn down with the price action now below the line. Momentum has been showing greater weakness than the price action and made a short term negative divergence at the top last week. The daily volume activity, which seemed to be perking up lately, has once more started to go wishy-washy on us and started to get weak. Shown on the chart is a strong short term support at the $614.50 level. Should the price close at $614.00 or lower we can expect continued decline to possibly at least the previous Oct low. One might take this as a short term head and shoulder pattern. We had a significant advance leading up to the head (a requirement in my view for an H&S) and most importantly a negative divergence in the momentum indicator at the head. Momentum was slightly lower than its previous high as the head made a higher high. Should the support (neckline) be broken then an H&S projection would take us only to the $591 level. This would be only of interest to very short term futures or options traders as that would be the only place one would be able to make reasonable gains on such a short move. My view is more of an intermediate term focus so such a move may be interesting but not too important in the intermediate term.
Although I am guessing that a short term reversal of trend is at hand the actual reversal, in my view, has not yet been fully confirmed technically. Staying with the confirmed trend in hand I will remain bullish on the short term BUT would reverse to bearish on a close below the $614.50 level.
IMMEDIATE TERM
Some are confused as to why I have a short term commentary and an immediate term one. They should, in most reader's eye, be the same. The only reason for having an immediate term commentary is to see if I can guess the direction of the next day or two of action. For want of better terminology, it's an EGO trip,
As I was looking at the chart to assess the immediate term trend I drew the red line and voila, a triangle. Now triangles are considered continuation patterns and often occur mid-way up the trend, so if this is a triangle then we are mid-way towards the $689 level. I needed that so that regardless of which way the price went I could say I told you so.
My view, however, is that this is not one of those triangles. With the price below its very short term moving average line (8 DMAw) and the aggressive Stochastic Oscillator (SO) already in a down trend below its trigger line and quickly heading towards its neutral line, the direction of the price will continue lower. My guess is that the direction for the next day or two would be on the down side. Again, guessing with one eye on the technicals, the action should take the price below the support and go into that short term bear referred to above. The only slight technical caution to this scenario is Friday's action. Let's see what the candlestick charts shows for this one trading day.
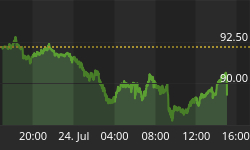
The candlestick is green indicating that the price closed above the previous day's close. The rectangular box part of the candlestick is open (as opposed to fully colored in). This indicates a close that is above its opening price. The close is therefore very close to the high for the day with most of the day's activity below the close level. This suggests that after some initial weakness the price was showing strengthening downwards the close and moving upwards. The big question is if that strength will continue into Monday. I usually go with this one day show of strengthening but today I am more inclined to go with the continuation of a several day trend. A move to $630 would change my immediate term perspective.
NORTH AMERICAN GOLD INDICES
Round and round we go and it's once more the turn of the AMEX Gold BUGS Index (HUI) to be looked at in this rotation of the majors. Nothing that much has changed since we last looked in on the BUGS, or HUI as it is often referred to by its ticker symbol. As most know, BUGS stand for "Basket of Unhedged Gold Stocks". It is supposed to be superior to the PHLX or S&P/TSX Indices because the component stocks have minimum (not zero) hedge positions. It is a more aggressive Index than the other two and very similar in performance to the other AMEX Index, the AMEX Gold Miners Index.
We still have the developing head and shoulder pattern but the longer it goes without validation by a neckline break the less it stays as a head and shoulder. What we also have developing here is a gigantic downward sloping wedge pattern. Here, the longer it develops (to a degree) the stronger it gets, and it is a continuation pattern. What we need to see here is a continuation of the Index inside the wedge for another month or so, then an upside break. In this Index we have both sides, a downside break for an H&S or an upside break for a wedge.
The thing that suggests the H&S as the next break is the weakness, up to now, in the momentum indicator.

MERV'S PRECIOUS METALS INDICES
Probably to no one's surprise the precious metals market had a losing week, and the Merv's Indices went along with the rest. While the 4 major North American Indices closed almost identically at 4.1%/4.2% lower the Merv's Indices were quite widely dispersed closing anywhere from 2.9% lower to 5.4% lower. Only the Merv's Spec-Gold Index closed lower than the majors, at 5.4%. This was due to 5 component stocks with double digit losses on the week.
The negative action during the week has not changed any of the previous analysis on the various Merv's Indices. One week does not a reversal make. For this reason and due to some time restraints I will forgo my usual weekly analysis of the sector Indices or of Silver. These will be back next week.
That EVIL Witchcraft
The latest issue of Investor's Digest of Canada (November 17. 2006) has a column by John Sartz, President and Chief Investment Officer of Viking Capital Corp. In that column Mr. Sartz seriously criticized the discipline of technical analysis, calling it a sub sector of witchcraft, and strongly supported the concept of "averaging down", i.e. buying more stock as the price declines. This is not the forum to tear into Mr. Sartz criticisms of technical analysis or his support for averaging down. It does, however, give me the lead in to show how technical analysis provides investors with improved profits and helps lessen potential losses.
Over the past two weeks I have shown precious metal stocks that have had great performances over the past year or so, including during these past several months of market slide. I have also shown at what point the simple technical technique used in my tables of technical information and ratings would have given its original buy (BULLISH) signal. Today I show another stock (Royal Standard Minerals Inc.) from my universe of 160, one that has gone up and down. Here I show how the technical tables would have gotten one out of a developing serious down turn. The arrows show where the original buy was given (green arrows) and where the sell was given (red arrows).
The intermediate term technical rating turned POS (or BULLISH) on 08 July 2005 at $0.42 and did not turn NEG (BEARISH) until 12 May 2006 at $1.25 for a 10 month gain of 198%. Since the NEG rating the stock has declined almost 60%. Now, I have no knowledge about the fundamentals behind this stock, but on the other hand, I don't care. As Mr. Sartz himself stated, "keep in mind the idea is to make money on stocks, not to come up with the pithiest clichés". As for averaging down, I don't think many "investors" would be feeling very happy if they had been averaging down during the past several months.

Technical analysis is not only the art of picking the appropriate timing for your purchase, depending upon your level of risk, but also picking the appropriate timing for your sale to lock in the best potential profit or to protect your capital against unexpected loss. Market timing is not possible, if you are a fundamentalist. Market timing is possible (but remember, nothing is perfect, that is where the protection of capital comes in) only by the art of technical analysis. When you hear or read of someone claiming that market timing is not possible, you know you are dealing with a fundamentalist who does not have any appreciation, or knowledge, of technical analysis.
Whatever the technique that you use for your investment or speculative endeavors, if the technique works for you and you are happy, stick with it. If the technique does not work for you and you are unhappy, don't complain but take a good look around and change your technique to something that works for you. YOU are in control of YOUR OWN fortunes.
MERV'S PRECIOUS METALS INDICES

Click to open larger image in new window.
Let's call it another week.


