


The following article was originally published at The Agile Trader on Sunday, December 3, 2006.
Dear Speculators,
I want to start out this week's note looking first at the TIPS market (Treasury Inflation Protected Securities) and then at 3 "commodity" charts (if currencies can be included as commodities) because they are telling disparate stories.
First, the TIPS market has an extremely sanguine view of inflation.

As of Thursday, 11/30 the TIPS market was pricing in about a 2.23% inflation rate over the next 5 years. Nice, eh? Less than a quarter point above the top of the Fed's "comfort zone" and probably close enough for horseshoes (or monetary policy).
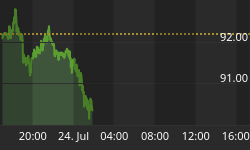
But, look at what other markets are saying. First, the US Dollar:

This longer-term chart of the US Dollar Index shows a significant breakdown from the shallow rally of earlier in '06. And while pass-through of this kind of currency depreciation to consumer inflation is generally just a fraction of 100%, the depreciation itself, especially because of its swiftness, poses destabilizing risks, as it COULD begin to force foreign investors to question the value of dollar-denominated investments.
Currently the 80.50 level presents obvious support. A break below 79.18 (the low of 1992) could be an indication that a more major adjustment is underway.
But let's stop and think for a minute about the logic of these first 2 charts. The bond market's belief in the benignity of US inflation is associated with the further belief that the Fed will not be raising the Fed Funds Rate any time soon (and indeed the futures markets are pricing in high probabilities of rate cuts next year). The belief that the Fed will lower interest rates then drives the US Dollar lower as investors scurry to exit the short end of the US Interest Rate Curve in favor of moving to, say, European fixed income investments, which the markets currently anticipate will be gaining in yield as the EU raises rates.
But the weakening dollar is Inflationary, which in turn works to raise the prices of Oil and Gold (among other things, charted below). And rising Oil and Gold prices are both further considered to be inflationary.
Is it any wonder that Bernanke et al are jawboning the market to the effect that the Fed will be vigilant about upside inflation risks even as they allow the futures markets to price in rate cuts? This Fed is not so much concerned with inflation itself as inflation expectations. But it remains to be seen how those expectations will be affected if the US Dollar Index moves below 80, if GLD (the ETF that trades at about 1/10 the price of Gold) breaks up through the $66 area...

(the top of the yellow highlighted area on the chart above), which would also be inflationary...
and if Crude Oil were to rise back up into the high $60s, which this next chart suggests is pretty likely.

Crude has retraced about 38% of its summer-autumn decline and appears to be breaking to the upside as winter heating season gets a slightly late start.
A trip up to the 62% retracement line (near $69) in the XOIL pane looks likely, assuming that a break of $64 occurs and then holds.
Now, look at the very strong inverse correlation (-0.90) over the past 100 days between the SPX (green in the lower pane) and Oil. Will the stock market be able to continue rallying of Crude breaks to the upside? I would think that the in move in Crude over $62.50 would get the stock market's attention. But maybe it'll take a clean break up through $64.
And how is the TIPS market going to like a world with Crude over $65 and Gold over $650?
Will those scenarios obtain? Perhaps not, but the risks look pretty high at this point that they will....at least (ironically enough) as long as futures traders keep pricing in near-term Fed rate cuts, the anticipation of which is inflationary. (The irony I speak of here is that expectations of low inflation push the market to price in rate cuts, the expectation of which drive down the dollar and drive up commodity prices, the rise of which are inflationary, which diminishes the probabilities of rate cuts!)
Inflation may indeed fall. But at this point there really are some serious upside risks described by the falling dollar as well as rising commodity prices and a pretty-tight labor market.
As for risks to near-term economic growth, the Yield Curve (spread between the 10-Yr Treasury Yield and the Fed Funds Rate) has struck its most inverted posture of the cycle.

While our cyclical expectation has been for PE expansion in the coming year, we continue to see that as a difficult proposition with the yield curve continuing to increase its inversion.
Now, maybe this time it's different. Maybe "this time" extremely cheap money coming out of Japan will make the inverted US Yield Curve irrelevant. But, as recent history has taught us (think Tech Bubble), "this time it's different" is a tenuous investment thesis. By definition, in order for this time to be different, it has to defy precedent.
Now I'd like to show you 2 more charts that, in combination, provide food for thought.
This first one shows Corporate Profits as a percentage of GDP.

As you can see, Before Tax Profits are at their highest level since 1950. And After Tax profits are at their highest post-war level ever.
I've mentioned these very high profit margins before, but on this chart we can see the mean-reverting tendency. That is, Corporate Profits as a Percentage of GDP tend not to hover around at very high levels but tend to spike up and down. And we have just enjoyed the mother of all post-war up-spikes. So, if history is our guide, then we should look for these lines to drop at least somewhat, perhaps bringing the blue line down toward the 9-10% level.
With the bond market now pricing in something in the neighborhood of 4.5% Nominal GDP (that's what the 10-Yr Treasury Yield (TNX) is, and TNX tends to be pretty close to Nominal GDP), and with profit margins likely to retreat at least somewhat during the next couple of years (it would be unprecedented for Profits as % of GDP to remain this high), continued double-digit profit growth looks like it would be tough to come by.
Now, this next chart shows a terrifically strong correlation between the Y/Y change in the Fed Funds Rate and the Y/Y change in Forward 52-Week EPS Consensus.

The very strong correlation was somewhat thwarted by the Fed's leaving the Fed Funds Rate very low in '03 and '04 as profit growth exploded. But, at this point, we can see that the strong positive correlation has been re-established.
Going forward the red line (Y/Y Change in FF Rate) is likely to continue to decline as the Fed stands pat (or cuts rates). And historically that suggests that the blue line ( Y/Y Change in Forward 52-Week Consensus for EPS) will do likewise.
Once again, while our cyclical expectation is for PE expansion during the coming year, inflationary risks, the inverted Yield Curve, and the probability of slowing profit growth will work at cross purposes to that PE expansion, perhaps limiting the market's upside.
Best regards and good trading!


