


Doug Wakefield with Ben Hill
Living near Dallas Fort Worth International Airport, it's not uncommon to see several planes approaching or departing the area. A few days ago I heard, but could not see, a plane making its descent to the airport. Due to the heavy cloud cover, no matter how hard I looked, it was impossible to locate the plane. And, though this was nothing more than a mildly interesting part of my day, it occurred to me that, though they were likely unaware of it, this was a critical moment for the passengers who had entrusted their very lives to the pilots and the air traffic control tower. Of course, as with most flights, since the pilots and the control tower relied on their instrument panels, all went off without incident. But without constantly monitoring a great many technical factors, the set of events stood a high probability of failure that, in the words of professional trader Nicholas Taleb, would have been, "too costly too bear."
In many ways, navigating the markets is like landing a plane on a foggy day. Intuition tells us one thing, but the markets react in the polar opposite direction. Over time, many come to believe that the market is just too complex, and that the safest thing to do is to follow the traditional advice espoused by most individuals. But is this the way that professional traders make decisions, or do they exhibit patterns similar to the thought processes of a professional pilot?
In the last few month's numerous contrarian indicators have been pushed to historic extremes. And though some may be tempted to follow their intuition and "go with the flow," we'd do better to review the lessons we spoke about in Hard Wired to Fail earlier this year. For those of you who are concerned about the numerous confusing signals you are receiving, I would strongly encourage you to read "Traits of an Excellent Manager," a section from our industry research paper on short selling titled, "Riders on the Storm." As numerous economic and social news items are hitting the daily headlines, it's important that we don't allow ourselves to believe that flying through clouds of uncertainty is the same for pilots as it is for passengers.
But, before we get started, we should note that the financial planning profession was not designed to train advisors in the tools of trading. As such, most individuals giving advice are not "pilots," and they are not familiar with a "pilot's" instrumentation. For this reason, most investors and advisors work off of intuition and stories, and end up chasing recent returns and looking for the appropriate mix of various stock indices. This works well in an environment where all markets move up together on an ever-rising sea of liquidity. But what would happen, God forbid, if credit started contracting?
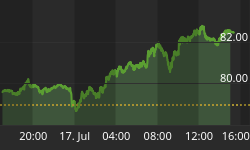
Back in late August, it appeared that the markets were going to get hit hard. Seasonally, September and October are bad times for stock investors. And, with the housing sales sliding south, auto sales getting clobbered (in June and July), and all the major US indices at historic highs, it looked like an excellent time to go opposite the herd. It looked like the storm was right in front of us. Since that time, if we look at housing stock prices, reflected in the Philadelphia Housing Index, it looks like the storm has cleared. Yet a more careful perusal of numerous media articles and several government data sources is more likely to lead us to forecast a storm delay rather than clear skies. Which is correct?

If you'd seen this chart in August, would you've said, "Wow, with such a sharp decline, it must be time to buy!" If this wasn't your response, let me reassure you, you're not alone. In fact, in my 21 years of practice, I've never had a client call me up after a decline of this magnitude and tell me they were ready to buy.
But, since then, the price levels that continue to come in from the markets seem somehow disconnected from the headlines. At the same time, investors have come to believe that if they follow certain conventional rules, no pilots are needed. Worse still is the fact that, as shown in a recent paper from the Yale School of Management titled, "How Active is Your Fund Manager?", many "pilots" aren't even observing their instruments anymore.
But good pilots are constantly looking out over the horizon to try to anticipate trouble before it arrives.

If you've been reading the various articles and documents highlighted in our monthly Noteworthy email, then you'll recognize the chart above as one produced by Paul Kasriel, Chief Economist of Northern Trust, in his article, "Near a Housing Bottom?" In that November 8th article, Kasriel confronts us with the fact that the amount of money withdrawn from home equity borrowing has contracted from an annualized pace of $732 billion, at the end of the 3rd quarter of 2005, to $327 billion, at the end of the 2nd quarter of 2006. Now look at that number again. That is a contraction of $400 billion in home equity loans in 3 quarters. Equally alarming is the amount of home equity borrowing that has taken place since 2000, when compared with the previous 45 years.
This next chart was produced in a November 1st 2006, CNN article called, Can the Economy Survive a Housing Bust?" The article opens as follows:
 "Tucked away in the briefcase of Liz Ann Sonders, chief investment strategist at Charles Schwab & Co, is a chart so scary she's hesitant to show it to investors. It plots the National Association of Home Builders' Housing Market index - a monthly measure of builder confidence - against the Standard & Poor's 500 stock market index, with a one-year lag."
Seeing how intertwined these two indices have been for over a decade and how precipitously the NAHB Housing Market Index has fallen, I can understand Sonders' reluctance to show this chart to investors. Not exactly a buy-and-hold confidence builder.
The following chart is from the November issue of our research newsletter, The Investor's Mind, titled, "Hot Potato, Hot Potato." The data was taken from the Federal Reserve's Quarterly Flow of Funds report.

From this chart, we can see that from the end of 2001 through the third quarter of 2005, Americans increased their borrowing through home mortgage products from an annualized pace of $529 billion to $1,323 billion. Clearly, since Americans' wages did not go up proportionately, this growth rate was not sustainable. Sure enough, as Paul Kasriel illustrates in the article referenced above, the amount of money borrowed through home mortgages collapsed in just three quarters. The annualized pace of borrowing has declined from $1, 323 billion to $858 billion. This is a contraction of credit throughout the lending industry of $464 billion in three quarters, a number that is not all that far from the entire amount U.S. households borrowed long ago... in 2001.
So with articles, charts, and data like this being presented to investors and managers at all levels of our financial markets, what do you guess the reaction of investors to housing stocks would have been? Would they buy and hold housing stocks or sell, or sell short, housing stocks? See for yourself.

So let's play a game of "You Make the Call." It is the middle of October and you have seen the housing market index bounce back from 191 in mid August to 220 by the middle of October. Would you've said, "With all of the negative information and headlines about housing, I am selling my housing stock"? Or, with all of this information, would you've said, "I bet housing is getting stronger and thus housing stocks will continue to climb." What information would you use to decide when to sell? Would you ever sell this "bastion of safety?" If you held since the summer of 2005, would you feel the same way about housing stocks as those who purchased in August of 2006?

If you are an investor, or passenger, on this historic flight of "no risk all rewards," I encourage you to climb into the cockpit with me through reading some of the 100 articles or documents found on the educational portion of www.bestmindsinc.com. If you want to understand why the markets have gone up in the last four month's and why there are certain things that even pilots cannot control, then I encourage you to join the group of individuals that pay for my insights in, The Investor's Mind. If nothing else, remember this: without non-emotional, technical tools to guide the pilot through the clouds to the runway, that pilot is just flying on hope that he will hit the runway for a soft landing. In today's world, where more risks are brought to the fore in every day's headlines, that is not a risk that I would be willing to take.
To read some of our other postings and learn about our educational services, we encourage you to visit our website. Our industry research paper on short selling, Riders on the Storm: Short Selling in Contrary Winds, is available to those who subscribe to our monthly newsletter, The Investors Mind: Anticipating Trends through the Lens of History.


