


2/11/2007 9:57:23 AM
The market is catching up to our call - here's what we see.
Welcome to the daily stock barometer. This article comes out every day and gives our short term view of the market. If you're interested in following our signals and learning more about our system, then I invite you to click here and subscribe - since the market can turn on a dime and so too can our interpretation as the market gives its daily clues to the future. Or sign up for our free weekly newsletter, where we provide up to date articles from our various trading services. We're also going to be releasing a free trading video in 2007 - so sign up today.

Stock Barometer Analysis
The barometer remains in Sell Resistance Mode. The market has performed as we've expected and discussed during this week, testing our resistance level, getting complacent and retracing sharply in true head and shoulders fashion. We'll discuss price objective/points below.
The Stock Barometer is my proprietary market timing system. The direction or slope of the Stock Barometer helps determine our outlook on the market's direction. For example, if the barometer line is moving down, we are in Sell Mode. A Buy or Sell Signal is triggered when the indicator clearly changes direction. The black line is a 5 day moving average of the barometer and may be used to confirm changes in direction. All the information contained in this email is considered in making our calls.
Stock Barometer Cycle Time
Monday is day 17 in our down cycle. The cycle is obviously extended as we've remained in Resistance sell mode. This is where we delay a buy signal until a price point is broken and this is how the barometer employs basic technical analysis (support and resistance) into its calls.
The Stock Barometer signals follow 5, 8, 13, 21 and sometimes 34 day Fibonacci cycles that balance with 'normal' market cycles. Knowing where you are in the current market cycle is important in deciding how long you expect to maintain a position.
Potential Cycle Reversal Dates
2007 Potential Reversal Dates: 1/10, 1/14, 1/27, 1/31, 2/3, 2/15, 3/9. We publish these dates up to 2 months in advance.
This is an interesting set up. The market topped on our previous date (2/3). Note when I talk about the market in relation to reversal dates it's going to be the NYSE - since they're more correlated than the Nasdaq. If we get a move lower into 2/15, I'd expect one final blow off type move higher into 3/9. However, if we get the market hanging around or retesting this move lower into 2/15, then we're looking at a larger move lower into 3/9. So what happens next week will determine what happens next month - so to speak.
My Additional timing work is based on numerous cycles and has resulted in the above potential reversal dates. These are not to be confused with the barometer cycle times. However, due to their accuracy I post the dates here. These dates are used to influence how quickly we issue a buy or sell signal.
2006 potential reversal dates: 1/16, 1/30, 2/25, 3/19, 4/8, 5/8, 5/19, 6/6(20), 7/24, 8/20, 8/29, 9/15, 10/11, 11/28.
2005 Potential reversal dates based on 'other' cycle work were 12/27, 1/25, 2/16, 3/4, 3/14, 3/29, 4/5, 4/19, 5/2, 6/3, 6/10, 7/13, 7/28, 8/12, 8/30-31, 9/22, 10/4, 11/15, 11/20, 12/16.
The following work is based on my spread/momentum indicators for the QQQQ, SPY, XAU, GLD and TLT. They are tuned to deliver signals in line with the Stock Barometer and we use them only in determining our overall outlook for the market and for pinpointing market reversals. I provide the spread indicator charts at least weekly and when they deliver reversal signals. The level, direction, and position to the zero line are keys in these indicators. For example, direction determines mode and a buy signal 'above zero' is more bullish than a buy signal 'below zero'.
QQQQ & SPY Spread Indicator
The QQQQ and SPY Spread Indicators are in Sell Mode, above zero.

The QQQQ and SPY Spread Indicators will yield their own buy and sell signals and may be in Buy and Sell Mode that is different from the Stock Barometer.
Gold & Silver Sector Index Spread Indicator (Index:XAU.X)
The XAU and Gold Spread Indicators are in Buy mode, above zero.

The dollar Spread Indicator remains in Sell Mode, crossing below zero.

I monitor Gold in the form of GLD and the XAU as well as the US Dollar Index as a general guide to the overall health of the US Economy and the markets, as well as to assist us in the entry of positions in our Gold Stock Service.
Bonds Spread Indicator (AMEX:TLT)
The Bond Spread Indicator remains in Buy Mode, above zero.

I include bonds in our studies and use Lehman's 20 year ETF, as the direction of bonds can have an impact on the stock market. Normally, as bonds go down, stocks will go up and as bonds go up, stocks will go down.
Supporting Secondary Chart

I have over 100 technical indicators, some that are widely followed and some that are proprietary. These indicators break down the market internals, sentiment and money flow and give us unique insight into the market. I feature at least one here each day in support of our current outlook.
Summary of Daily Outlook
We remain in Sell (Resistance) Mode projecting a move lower into 2/15, our next key reversal date. Given the fact that 2/16 is options expiration, the potential for the market to bounce slightly into 2/15 increases. However, that would be great (as long as it remains below the previous price high) as it would set up a larger move lower into March 9th.
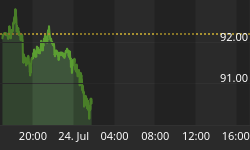
Here's a chart of the Qs which sets up my outlook:

I think it's important to understand how all the components on this page fit into my forecast. I received some questions on the key reversal dates that I'd like to explain for all readers. The barometer chart doesn't incorporate these dates. How they get incorporated is in making our calls. The barometer has a subjective component that allows for slight variability in entering signals. When the barometer is issuing a signal around a key reversal date, the proximity of that date to the signal is considered. For example, if we have a key reversal date of today and the barometer issues a daily turn the following day, I'm more inclined to change modes on the early part of the signal curve. If the reversal date is a few days away, I'm more inclined to wait for the barometer 5-day line to be violated or for it to turn if the timing is even more delayed.
You see, to me the market is a big sine wave, and we're trying to buy and sell at various points along the curve. Sometimes we'll be early, sometimes we'll be late, sometimes we'll be right on - and sometimes we'll be totally wrong. We make the best decision based on the system variables at the time it's appropriate to make the decision. Once made, the focus shifts towards the next signal, not at analyzing our decision based on all the 'new' information that occurs following the signal. That's called hindsight and it has no place in any thought process - especially trading.
Again, welcome to the daily stock barometer. This article comes out every day and gives our short term view of the market. If you're interested in following our signals and learning more about our system, then I invite you to click here and subscribe - since the market can turn on a dime and so too can our interpretation as the market gives its daily clues to the future. Or sign up for our free weekly newsletter, where we provide up to date articles from our various trading services. We're also going to be releasing a free trading video in 2007 - so sign up today.
As always, if you have any questions or comments, feel free to email me at Jay@stockbarometer.com.
Regards,


