


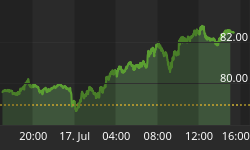


This past week The Agile Trader Index Futures Service netted a 10.5% profit in the e-mini Nasdaq 100 futures market. That brings the service's net position gains to 73% year-to-date with a net portfolio gain of 19%.
If you would like to read more about The Agile Trader Index Futures Service or take a free one-month trial to the service, please click HERE
The following article was originally published on April 1, 2007 at The Agile Trader
Dear Speculators,
Last week we discussed two different interpretations of the 4-year cycle in the stock market and we laid out parameters according to which we will likely end up determining which is correct: if the SPX breaks below the March closing low of 1374 then the 4-year cycle low that we had expected to arrive last autumn is very probably still ahead of us; and if the SPX breaks above the February closing high of 1460 before it moves below 1374, then we will stick with our original view that the new 4-year SPX cycle began last July.
THE YEN
As we discussed in this space on March 4 and March 11, what happens with the Japanese yen will be a significant determinant of which model of the 4-year cycle turns out to be more helpful. If the June yen contract breaks above 0.89 ($0.89 per 100 yen) then pressure will again increase on those heavily leveraged to the yen to unwind their carry trades, forcing accelerated buying of the yen and accelerated selling of all things dollar denominated (e.g. US stocks and bonds, and even gold).
The action in the yen over roughly the past 4 weeks has been essentially benign and has helped to stabilize global financial markets.

As you can see on this chart of the June futures contract, the yen has consolidated the large jump made in late February and early March, and has compressed its trading range in a triangle that has a horizontal lower limit hear 0.8525 with a descending upper limit, now down near 0.8625
This triangle is approaching a breaking point. Should the triangle break down, with the yen trading down toward 0.85 or lower, that will very likely be bullish for US stocks. But if the triangle breaks to the upside, well, caution would be warranted for those making bullish bets in US stocks, and the risk of the SPX testing and/or breaking 1374 to the downside would significantly increase.
Hey, globalization may be grand, but it's a two-edged sword. With so many borrowed yen having been converted to investments in all manner of instruments, both paper and real, denominated in just about every currency imaginable, global financial markets are more interrelated and interdependent than ever before. So, if the yen sneezes, US markets will get sprayed.
EARNINGS AND OIL
With 1Q07 now in the books, and with both Earnings Warning Season and then Earnings Season hard upon us, there's a lot worth thinking about in our pictures of analysts' estimates.
The analysts' consensus for the SPX's Forward 52-Week Earnings Per Share (F52W EPS, blue line below) dropped again last week, now down $1.16 from its all-time high of January 19, '07 to $95.36.

Note: This consensus estimate uses a top-down trend rate of growth for 1Q08, as Standard & Poors has not yet published quarterly bottom-up estimates beyond 4Q07. Once those new '08 estimates are published we may see some fluctuation in the blue line.
Using these numbers the consensus for earnings growth during the coming 52 weeks is in a decelerating trend, now at +7.4%. While forward growth doesn't look too bad, the deceleration of growth may be cause for concern, especially in the context of sluggish GDP growth with a below-trend 2% handle on it.
On a sector-by-sector basis we see that Health Care is beginning to really impress in terms of the direction of earnings expectations (purple line below). As are the Industrials and Telecom Services.

While Energy and Financials show huge gains in earnings expectations over the past 18 months, those positive trends are most recently showing signs of aging.
Tech's earnings trend is deteriorating. The Financials, Utilities, Consumer Staples, Materials, and Consumer Discretionary sectors look to be market performers in terms of the change in forward expectations.
And Energy is expected to show negative earnings growth during the coming year.
(See the XOIL chart below for further discussion on the Energy sector and the chart's macroeconomic implications.)
Given the sector-by-sector hodge-podge above, here's an interesting chart that may be of interest to stock-market bulls who are feeling a big queasy lately. This chart uses sector-by-sector earnings estimates and calculates the SPX's expected rate of earnings growth (red line) along with the SPX Less Energy's expected rate of earnings growth (blue line).

Because of weighting and methodology issues these numbers don't line up precisely with the our previous earnings chart, but one thing is clear here: The SPX's expected rate of earnings growth is LOWER than is the SPX Less Energy's expected rate of earnings growth. Which is to say that analysts currently expect NON-ENERGY companies' growth to outpace Energy companies' growth. And the positive separation on this chart (the extent to which the blue line is rising faster than the red line) is accelerating.
If those expectations are realized, that would be a very "Goldilocks" (higher growth with lower inflation -- the inverse of "stagflationary") scenario.
Of course, the sixty-four-billion-dollar question is whether this scenario will indeed play out. With Crude Oil having just this past week broken to the upside out of a substantial Inverse Head & Shoulders Bottom, it may be that analysts' estimates have some catching up to do.

Technically, this upside breakout through the neckline gives us an intermediate target of $70 on Crude, and, ultimately a possible run at $74.
If Crude trades durably up in the $70s, then Energy companies' estimates probably need to rise and just about everyone else's estimates need to fall.
The Yen, Earnings, Crude Oil, Economic Growth…we've got cross-currents running in all directions. And it appears that the market is going to continue to try to frustrate both bulls and bears alike for at least a little while longer.

Since November the trends in both 1) the market's Price/Earnings Ratio (blue line above) and 2) the inversion of the yield curve (red line, which is the 10-Yr Treasury Yield less the Fed Funds Rate) have been mainly flat.
Though it's hard to keep it in mind as the market goes through its daily peregrinations, the SPX has in essence been digesting and consolidating the gains made off the July low, as we had been expecting.
As the Y/Y change in F52W EPS (blue line below) continues to slowly decline during this spring, and as the Fed Funds Rate's Y/Y change (red line below) continues to gradually decelerate along with it, we continue to look for the Fed to remain on hold at least until well into 2H07.

At the current rates of decline, both the red and blue lines on this chart will hit their long-term medians around the end of June (0% and 7.5% respectively). And we would not expect the Fed to start cutting interest rates unless/until these lines show clear indications that they are going to spend some significant time dwelling below their median levels.
THE YEAR-END TARGET
So, where do all these crosscurrents leave us?
This monthly chart of the SPX may be helpful.

When the SPX broke out above the neckline of its Inverse Head & Shoulders bottom in late 2004, and then passed the test down to that broken neckline by breaking to new higher highs in mid '05 an upside breakout target was established near 1550. This upside target is established by taking the "depth" of the Head (from the neckline down to the low at H) and adding that number to the point at which the chart breaks out above the neckline.
In this case the distance from the neckline down to the low of the "Head" is about 400 points. The breakout above the neckline came near 1150. So, add 400 to 1150 and we get a target of 1550.
Note that this 1550 target is the lower limit of our year-end target band of 1550-1600, which keeps popping up on our screens for all sorts of fundamental and technical reasons, and which we have discussed at length previously in this space.
Along the way to this 1550-1600 band, the 1400 level represents a "rest stop" at about 62% of the distance from the breakout to the ultimate target. We would expect the market to spend some time consolidating and gathering its energies near this 1400 level before "assaulting the castle" of its all-time highs.
Specifically, we're continuing to look for the market to continue consolidating the July-February rally until at least mid April and perhaps through May and deep into June. Beyond that, we're still looking for a push up to the 1550-1600 level before the year is out.
Best regards and good trading!


