


Signs Of The Times:
"So far in New York City it's the coldest April since 1874."
- Bloomberg, April 12
"Snow won't dampen Global-Warming rallies."
- Grand Rapids Press, April 13
"Feds may Renew Attack on Inflation."
"Dallas Fed President said that central bankers will have 'more work to do' and will be 'especially diligent' on inflation."
- Financial Post, April 13
At the risk of a grim play on words - "Author, Author!" In the above statement common sense is caught somewhere between a crock and a hard place. It is absurd for central bankers, who are the sole agents of chronic currency depreciation, to talk solemnly about "controlling inflation" or in this case being "especially diligent".
Of course with enough stimulation, which is the euphemism for depreciation, partiers are always ready to rock and roll.
"Investors regain their risk hunger."
The story of Peter MacKay in the April 16 Wall Street Journal included a cartoon showing fully-suited businessmen diving into shark-invested waters for a gleaming treasure chest on the ocean floor.
As the old saying goes, "Come on in, all the lemmings are doing it."
Stock Market: The huge zoom that prompted a cluster of "upside exhaustion" readings in February continues to be the salient feature. These readings had not been seen since 1Q 2000, which then suggested the possibility of a cyclical peak for the stock market.
The next steps in the pattern would be the initial plunge followed by a vigorous rebound to test the highs. It was noted that on the positive side this would be accompanied by strong commodities resulting in a vigorous culmination.
As observed last week, because this was coming in close to schedule it could be called "rational exuberance". The Dow rally from 12,243 on March 28 amounted to 548 points with gains being made on 12 out of 13 trading days. Nearterm momentum is close to the point that typically ends a rally.
Of interest is that the dollar index is approaching the equivalent oversold condition.
Overall it looks like the stock market is accomplishing a critical test of the February extravaganza, as the dollar is approaching the most significant low since late 2004. This makes sense as it is being accompanied by a significant low for gold's real price, and its worth adding - a possibly significant low for real long corporate interest rates.
On the big schedule the exuberance is flourishing within the window when the yield curve does the big denial usually found at the ending stages of a bull market. Typically the bull will run some 12 to 16 months against an inverted yield curve. February was month 12 and the curve has turned from maximum inversion at -15 bps in February to around 0 bps.
Often the transition to steepening marks the beginning of the postboom contraction. This pattern prevailed when central bankers were employed to maintain the gold reserve backing the currency until the central banks were corrupted by financial adventurers with reckless notions about a centrallyplanned economy.
In so many words, the inversion with a boom, and subsequent steepening is not policy-induced so there is little to be gained by "watching the Fed".
What's more we are likely at the time when there is little to be gained by watching the orthodox economic measures as well as each week's breathless anticipation of such announcements.
Market history records that there is a cycle for business activity, a cycle for credit expansion and then there is a cycle for share certificates.
Now this may be very oldfashioned, but the advantage of watching the behaviour of stock certificates is that at cyclical peaks they usually lead the business cycle by about 10 to 12 months.
This, along with central bankers chronically being some 3 to 4 months behind cyclical changes in shortdated market rates of interest suggests little to be gained from obsessing about Fed utterances.
The important thing is to appreciate when market forces will curb policymakers' compulsions to utter credit.
The advice was to lighten up as this rebound and test became exuberant.
INTEREST RATES
The Long Bond came down to 110.25 on April 5 and on April 13 to make a double bottom. Our target had been around 110 and the April 12 action noted that this was with low enough momentum to prompt a bounce to around 114.
The Yield Curve continues to work towards steepening. Maximum inversion, using the 10s to 2s, was 15 bps reached on February 21 just before the Chinarelated correction began on February 26.
The initial move was to 0 bps on March 22 then it inverted to 6 at the end of March.
Lately it's been close to 0 bps with some intraday pushes to +6 bps. We'll call this a trend change when it is a few bps beyond zero. The steepening trend is a strong indicator of contraction.
Credit Spreads took a hit with the China crisis from which complacency has returned. Corporate junk got out to 509 bps, over treasuries, on March 5 from which the spread has come in to 462 bps. The "low" was 446 bps on February 22 and any return to widening should be respected.
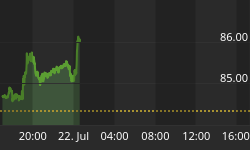
In this regard the collapse in subprime mortgage bonds took the price down to 73 on February 27 which was the day China took the 9 percent hit.
The rebound took the price to 84 on February 21 from which it slipped to 79.8 on April 3.
The next rally has made it to 83.05 yesterday.
We consider that this is a test of the initial rebound that will likely fall. The housing mania was enormous and the devastation has a long way to go. As Bloomberg wrote it yesterday, "Banks began foreclosure proceedings against 47 percent more US homeowners last month compared with a year ago as falling housing prices made it more difficult for borrowers to refinance mortgages."
This is a tragedy for suddenly unsupportable commitments and the establishment will turn to anything to "do something". The usual remedy is to suggest throwing more credit at a problem that is a result of excessive employment of credit.
One of the earliest such examples occurred in 1621 within the distress that followed an overusage of credit during the boom that ended in 1618.
The mortgage bond declining through 80 will likely be associated with spread widening in the traditional corporate bond world.
The Dollar Index didn't become oversold enough at our original target of 82.4.
However both the daily and weekly momentum things are close to the level associated with previous significant lows such as at the end of 2004.
The Canadian Dollar has moved up, relative to the US, with the commodity rally.
We've been fond of the Canadian dollar since the lows early in the year and with the improvement in Canada's Federal policies. It could get to par with the US.
However the change to weaker commodities will be a negative until a majority government becomes visible.
In the meantime the Canadian unit is overbought enough to limit the advance.
A trading range from around 89 to around 87 could prevail for a number of weeks.
COMMENTS FOR METAL AND ENERGY PRODUCERS
Energy Prices: Having accomplished a good rally to late March (67.05 on March 29), crude oil is in the usual season of decline.
While the possibility of politicallyinduced buying panic always exists the price usually declines to a significant low in late June - early July.
Oil patch stocks will follow from the XOI high of 1278 on Monday. As with other items, this index is overbought at levels that usually turn back rallies. More specifically, the last time it was as overbought was in March 2006 when a 14 percent decline followed. We have been long the sector since a lumpy entry last fall. Two weeks ago we advised to begin lightening up on the sector.
Natgas usually has its seasonal high in late April and the November high of 9 has been possible. Lately it's been having trouble getting through 8, and the momentum is neutral.
However, whether up or down, when seasonal moves are unapparent the action often rushes to set up the turn.
In the meantime stocks usually anticipate the turn and the XOI could be working on this. The high of 476 in December was likely to be exceeded and as noted last week, "at 498 today, this is the case and the momentum numbers are at highs that typically end moves."
The advice was to lighten up on both oil and gas stocks. Any attempt by Natgas to get to 9 would help.
A tradable decline for this sector is possible.
Base Metals: The April 11 ChartWorks used a number of techniques to demonstrate that the action in copper was as good as it gets and that a reversal was possible "right around the corner".
This, of course, is a proxy on the play and the pattern worth emphasizing was the completion of the "sequential sell" in base metals. This was accomplished and it seems to match up with the "sequential buy" pattern that was so successful in January.
On the shares, we've been riding the seasonal from the SPTMN November level of 560 (low was 509 in October) to the usual high in March. Last week's advice was to increase the rate of taking money off the table.
The mining stock index made it to 754 Wednesday and is sufficiently overbought to limit the up side in which case it's appropriate to continue selling.
Any great speculation is an abuse of the credit markets and the degree of damage done through aggressive use of leverage is rarely realized until the price goes down. As we've been noting, the action in nickel and tin has been outstanding perhaps to the point of danger.
Both are testing recent highs and it will be interesting to see how this works out. There is little point in repeating the percentage gains, but we are at the time when things can go wrong. The action has been against almost 14 months of yield curve inversion and we are within the window of a seasonal high.
Golds: As noted last week, the real price of gold (relative to commodities) is working on a cyclical bottom as the world of orthodox investments is working on a cyclical peak.
The outlook, then, for the gold sector is very bullish, and for stocks, lowergrade bonds and most commodities the risk/reward ratio is becoming daunting.
However, the rally in gold's nominal price has been with the weaker dollar and firming commodities. This is the usual gold bug compulsion and they have become rather excited, which is usually dangerous.
This morning the dollar is steady against an overnight slump in stocks, base metals and crude oil, which, beyond being seasonally correct, could be the failure of a critical test of the speculation.
With this gold bugs have been selling gold, and indicating some change in the credit markets silver has dropped relative to gold.
But before taking this a little further, gold stocks (HUI) and gold became moderately overbought and, technically, need a rest.
On the building cyclical bottom and pending cyclical bull market for the gold sector a number of developments have been required. These include the treasury curve reversing from inversion to steepening. Technically this is almost done. Another indicator would be the next step in subprime widening and the first big widening for orthodox junk, which seems inevitable.
Of these the most sensitive ones are the treasury curve, which could become acute as short rates extend their decline, and (shudder) long rates extend their increase.
The other indicator with immediacy is the gold/silver ratio, which typically sets a significant low as a boom concludes. This time around the ratio had a high of 82 when the boom launched in mid 2002. The decline to the key low of 46.7 on February 26 was appropriate to the good times.
However it, with the treasury curve, is working on a reversal possibly cyclical. With the postFebruary 26 correction the ratio increased to 51.3 in early March, and from it got back to only 48.7 on April 10.
At 50 this morning, going above 51 would reverse the trend and that would indicate the turn to a cyclical credit contraction. Typically, this prompts an increase in gold's investment demand.
With all the corruption in monetary concepts it is difficult to imagine a gold standard whereby the currency is convertible into a fixed amount of gold, in which case during a boom the price of commodities went up because of market demand. For example, base metals or energy prices would include no adjustment for currency depreciation.
During the centuries when the senior currency was convertible this prevailed and with each great boom gold's real price declined. This served an important purpose as the consequently diminished gold production would eventually reduce the credit available to fuel the boom.
Going the other way, gold's real price typically increases during a postbubble contraction in the usual credit instruments. This eventually increases the real liquidity in the global financial markets.
To get to today's condition, if base metal prices can rise in dollar terms because of increasing demand, gold can do it as well.
But this would be mainly due to investment demand.
For these reasons the outlook for the gold sector is very bullish and investments could be made on any moments of weakness.

". . . Traders who would formerly have taken the precaution of reducing their commitments just in case a reaction should set in, now feel confident that they can ride out any storm which may develop. But more particularly, the repeated demonstrations which the market has given of its ability to "come back" with renewed strength after a reaction has engendered a spirit of indifference to all the old time warnings. As to whether this attitude may not sometime itself become a danger signal, Wall Street is not agreed."
- New York Times, September 1, 1929


