


Oil is now very close to breaking out from the large Head-and-Shoulders bottom that we had earlier identified, and from the look of the latest oil COT chart, on which the Commercials short positions have shrunk dramatically, it is close to doing so - and if it does it will be on its way to $80 minimum. Needless to say this will be inflationary, and thus bullish for Precious Metals. Should this breakout occur, it will radically improve the outlook for gold and silver.

On the 6-month gold chart we can see that although gold has continued to decline over the past week or so, its rate of descent has slowed, so that a potential bullish Falling Wedge has appeared on the chart. In addition, short-term oscillators, shown at the top and bottom of the chart, are near their normal oversold limits, so there is certainly scope for a rally. Probably what we will now see is a strong rally from here followed by a reaction next month into the seasonal low period, before the advance resumes in earnest.
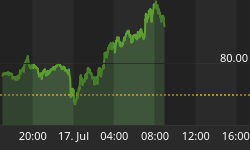
Finally a "V for Victory" intraday reversal appeared on the gold chart yesterday, providing additional evidence of a turnaround. While too much should not be read into the appearance of this Churchillian indication, viewed in conjunction with other indications it is a positive sign.

To the writer's knowledge, the V for Victory reversal was first spotted on the silver chart by Barb Moriarty of 321gold back in 2004, this sighting being reproduced below...


