


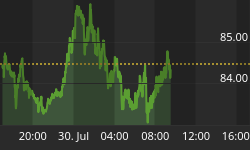


While the following charts are meaningless for predictive purposes, what they do tell us is we currently have a price pattern set-up eerily similar to the price pattern leading up to the January 2000 major top in the Dow Industrials.

In 1999, prices staged a dramatic 2,750 point rally over a one-year period, that had folks talking about Dow 35,000, with no end in sight for the glorious bull market. To be bearish was ridiculous. However, the unthinkable happened. In January 2000, a major Bear market started, which lasted through March 2003. Just prior to this historic top on January 14th, 2000, the DJIA rose 2,750 points over a 12 month period, with a significant correction about two thirds the time and price move through this extraordinary rally. Following that correction, the Dow Industrials rose another 1,750 points in a parabolic ascension over three months.
In 2006/2007, since July 2006, we have seen a 2,850 point rally over a ten month period, which has folks talking about Dow 35,000, with no end in sight for this glorious bull market. To be bearish seems ridiculous. About two-thirds the way through this time and price move, a significant correction occurred (late February 2007), which has since been followed by another 1,689 points in a parabolic ascension over three months. The point is, there is historic precedent for a major bear market to start immediately after such a price pattern. Our Demand Power and Supply Pressure indicators will tell us when and if such a bear market decline occurs.
"These things Jesus spoke; and lifting up His eyes to heaven,
He said, "Father, the hour has come; glorify Thy Son, that the Son
may glorify Thee, even as Thou gavest Him
authority over all mankind,
that to all whom Thou has given Him, He may give eternal life."
John 17:1, 2
For a Free 30 day Trial Subscription, go to www.technicalindicatorindex.com and click on the button at the upper right of the Home Page.
Our Memorial Day Specials are Good through May 31st. Click on the Subscribe Today or Renew Today buttons at the Home Page @ www.technicalindicatorindex.com


