


The good news is:
• The NASDAQ composite (OTC) closed at a multi year high on Friday and most of the major indices closed within 1% of their all time highs.
Short Term
Most of the major indices were up every day last week leaving the market overbought.
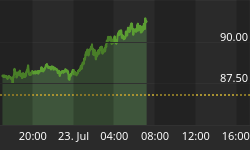
The chart below covers the past year. The OTC is shown in orange and a 5% trend (39 day EMA) of NASDAQ downside volume (OTC DV) is shown in brown. OTC DV has been plotted on an inverted Y axis so increasing downside volume moves the indicator downward (up is good). Dashed vertical lines have been drawn on the 1st trading day of each month.
OTC DV has been increasing since early last September and in the past week or so has decreased enough to touch the top of the line defining the down trend. If the pattern continues, we are very near a short term high in prices.

Intermediate term
New highs are a useful measure of the market health and they could be better. A declining number of new highs while prices are rising indicates participation is weakening.
The first chart covers the past year showing the OTC in orange and a 10% trend (19 day EMA) of NASDAQ new highs (OTC NH) in green. The OTC closed at a multi year high on Friday, but, it did it fewer new highs.

The next chart is similar to the one above except is shows the S&P 500 (SPX) in blue and the new high indicator has been calculated from NYSE data.

The next two charts are similar to those above except new highs have been calculated from the component issues of the index over the past 6 weeks rather than 52 weeks as reported by the exchanges.
The chart below shows the SPX in red and a new high indicator calculated from the component issues of the SPX in green.

The next chart shows the Russell 2000 (R2K) in red and a new high indicator calculated from the component issues of the R2K in green.

By any measure participation as measured by new highs has been deteriorating. However, bad as they are, the numbers are still large enough to suggest there are still higher price highs ahead.
Seasonality
Next week includes the 5 trading days ahead of the 2nd Friday of July during the 3rd year of the Presidential Cycle.
The tables show the daily returns for the week prior to the 2nd Friday in July during the 3rd year of the Presidential Cycle. NASDAQ data covers the period from 1963 - 2003 and SPX data from 1953 - 2003. Data prior to 1953 has been omitted because the market traded 6 days a week There are summaries for both the 3rd year of the Presidential Cycle and all years combined.
During the 3rd year of the Presidential Cycle the OTC has been up 64% of the time with an average gain of 1.15%, half of that gain has been made on Monday which has never been down. Over all years the OTC has also been up 64% of the time with about half the average gain of year 3. The SPX has been modestly positive over all periods.
Report for the week before the 2nd Friday of July
The number following the year is the position in the presidential cycle.
Daily returns from Monday to 2nd Friday.
| OTC Presidential Year 3 | ||||||
| Year | Mon | Tue | Wed | Thur | Fri | Totals |
| 1963-3 | 0.21% | -0.27% | 0.30% | 0.29% | 0.12% | 0.65% |
| 1967-3 | 0.71% | 0.23% | 0.70% | -0.18% | 0.25% | 1.72% |
| 1971-3 | 0.00% | 0.42% | 0.71% | 0.37% | 0.44% | 1.95% |
| 1975-3 | 0.44% | 0.48% | -0.69% | -0.30% | -0.13% | -0.20% |
| 1979-3 | 0.37% | -0.13% | -0.09% | -0.12% | -0.12% | -0.09% |
| 1983-3 | 0.00% | -1.38% | 0.63% | -0.04% | 0.18% | -0.62% |
| Avg | 0.50% | -0.07% | 0.25% | -0.05% | 0.13% | 0.55% |
| 1987-3 | 0.12% | 1.08% | 0.02% | 0.46% | 0.20% | 1.89% |
| 1991-3 | 1.15% | 0.86% | 0.73% | 0.25% | 0.89% | 3.88% |
| 1995-3 | 0.71% | -0.66% | 1.90% | 0.56% | 0.52% | 3.03% |
| 1999-3 | 0.00% | -0.15% | 0.23% | 1.05% | 0.76% | 1.89% |
| 2003-3 | 1.20% | -0.09% | -0.30% | -2.86% | 0.62% | -1.43% |
| Avg | 0.80% | 0.21% | 0.51% | -0.11% | 0.60% | 1.85% |
| OTC summary for Presidential Year 3 1963 - 2003 | ||||||
| Avg | 0.61% | 0.04% | 0.38% | -0.05% | 0.34% | 1.15% |
| Win% | 100% | 45% | 73% | 55% | 82% | 64% |
| OTC summary for all years 1963 - 2006 | ||||||
| Avg | 0.01% | -0.12% | 0.17% | 0.21% | 0.41% | 0.67% |
| Win% | 68% | 48% | 56% | 64% | 75% | 64% |
| SPX Presidential Year 3 | ||||||
| Year | Mon | Tue | Wed | Thur | Fri | Totals |
| 1955-3 | 0.00% | 1.21% | 3.57% | -1.39% | 0.14% | 3.54% |
| 1959-3 | -0.83% | 0.24% | 0.07% | -0.30% | -0.37% | -1.20% |
| 1963-3 | -0.68% | 0.43% | -0.21% | -0.19% | -0.17% | -0.83% |
| 1967-3 | 0.39% | 0.47% | -0.09% | 0.02% | 0.35% | 1.14% |
| 1971-3 | 0.00% | -0.02% | 0.28% | 0.30% | 0.35% | 0.91% |
| 1975-3 | 0.56% | 0.44% | -1.05% | -1.04% | -0.46% | -1.54% |
| 1979-3 | 0.82% | -0.26% | -0.54% | -0.92% | -0.36% | -1.25% |
| 1983-3 | 0.00% | -1.37% | 1.13% | -0.55% | -0.29% | -1.07% |
| Avg | 0.59% | -0.15% | -0.05% | -0.44% | -0.08% | -0.36% |
| 1987-3 | -0.24% | 0.99% | -0.08% | 0.73% | 0.60% | 2.01% |
| 1991-3 | 1.03% | -0.48% | -0.10% | 0.33% | 0.87% | 1.65% |
| 1995-3 | 0.15% | -0.43% | 1.10% | 0.02% | -0.20% | 0.64% |
| 1999-3 | 0.00% | -0.22% | 0.56% | -0.11% | 0.64% | 0.87% |
| 2003-3 | 0.57% | -0.34% | -0.64% | -1.23% | 1.18% | -0.47% |
| Avg | 0.38% | -0.10% | 0.17% | -0.05% | 0.62% | 0.94% |
| SPX summary for Presidential Year 3 1955 - 2003 | ||||||
| Avg | 0.20% | 0.05% | 0.31% | -0.33% | 0.18% | 0.34% |
| Win% | 67% | 46% | 46% | 38% | 54% | 54% |
| SPX summary for all years 1953 - 2006 | ||||||
| Avg | -0.03% | 0.00% | 0.12% | 0.08% | 0.27% | 0.45% |
| Win% | 58% | 46% | 55% | 58% | 67% | 63% |
Mutual Fund
Compliance issues demand that I not mention the mutual fund that I manage by name or symbol in this letter.
To see a current chart of the fund go to: http://finance.yahoo.com/q/bc?s=APHAX&t=6m&l=on&z=m&q=l&c=. For information about the fund go to: http://www.thealphafunds.com/index.htm. The fund now has service class shares available.
Conclusion
The market is overbought and the bull is getting a little tired, but, seasonally the week ahead has been pretty good.
I expect the major indices to be higher on Friday July 13 than they were on Friday July 6.
This report is free to anyone who wants it, so please tell your friends. They can sign up at: http://alphaim.net/signup.html. If it is not for you, reply with REMOVE in the subject line.
Gordon Harms produces a Power Point for our local timing group meetings. You can get a copy of that at: http://www.stockmarket-ta.com/.


